Gallery of pictures generated while preparing the course material
Resolution varies from figure to figure.
Gromacs’ 216 SPC water file
Images using the file spc216.gro that ships with Gromacs.
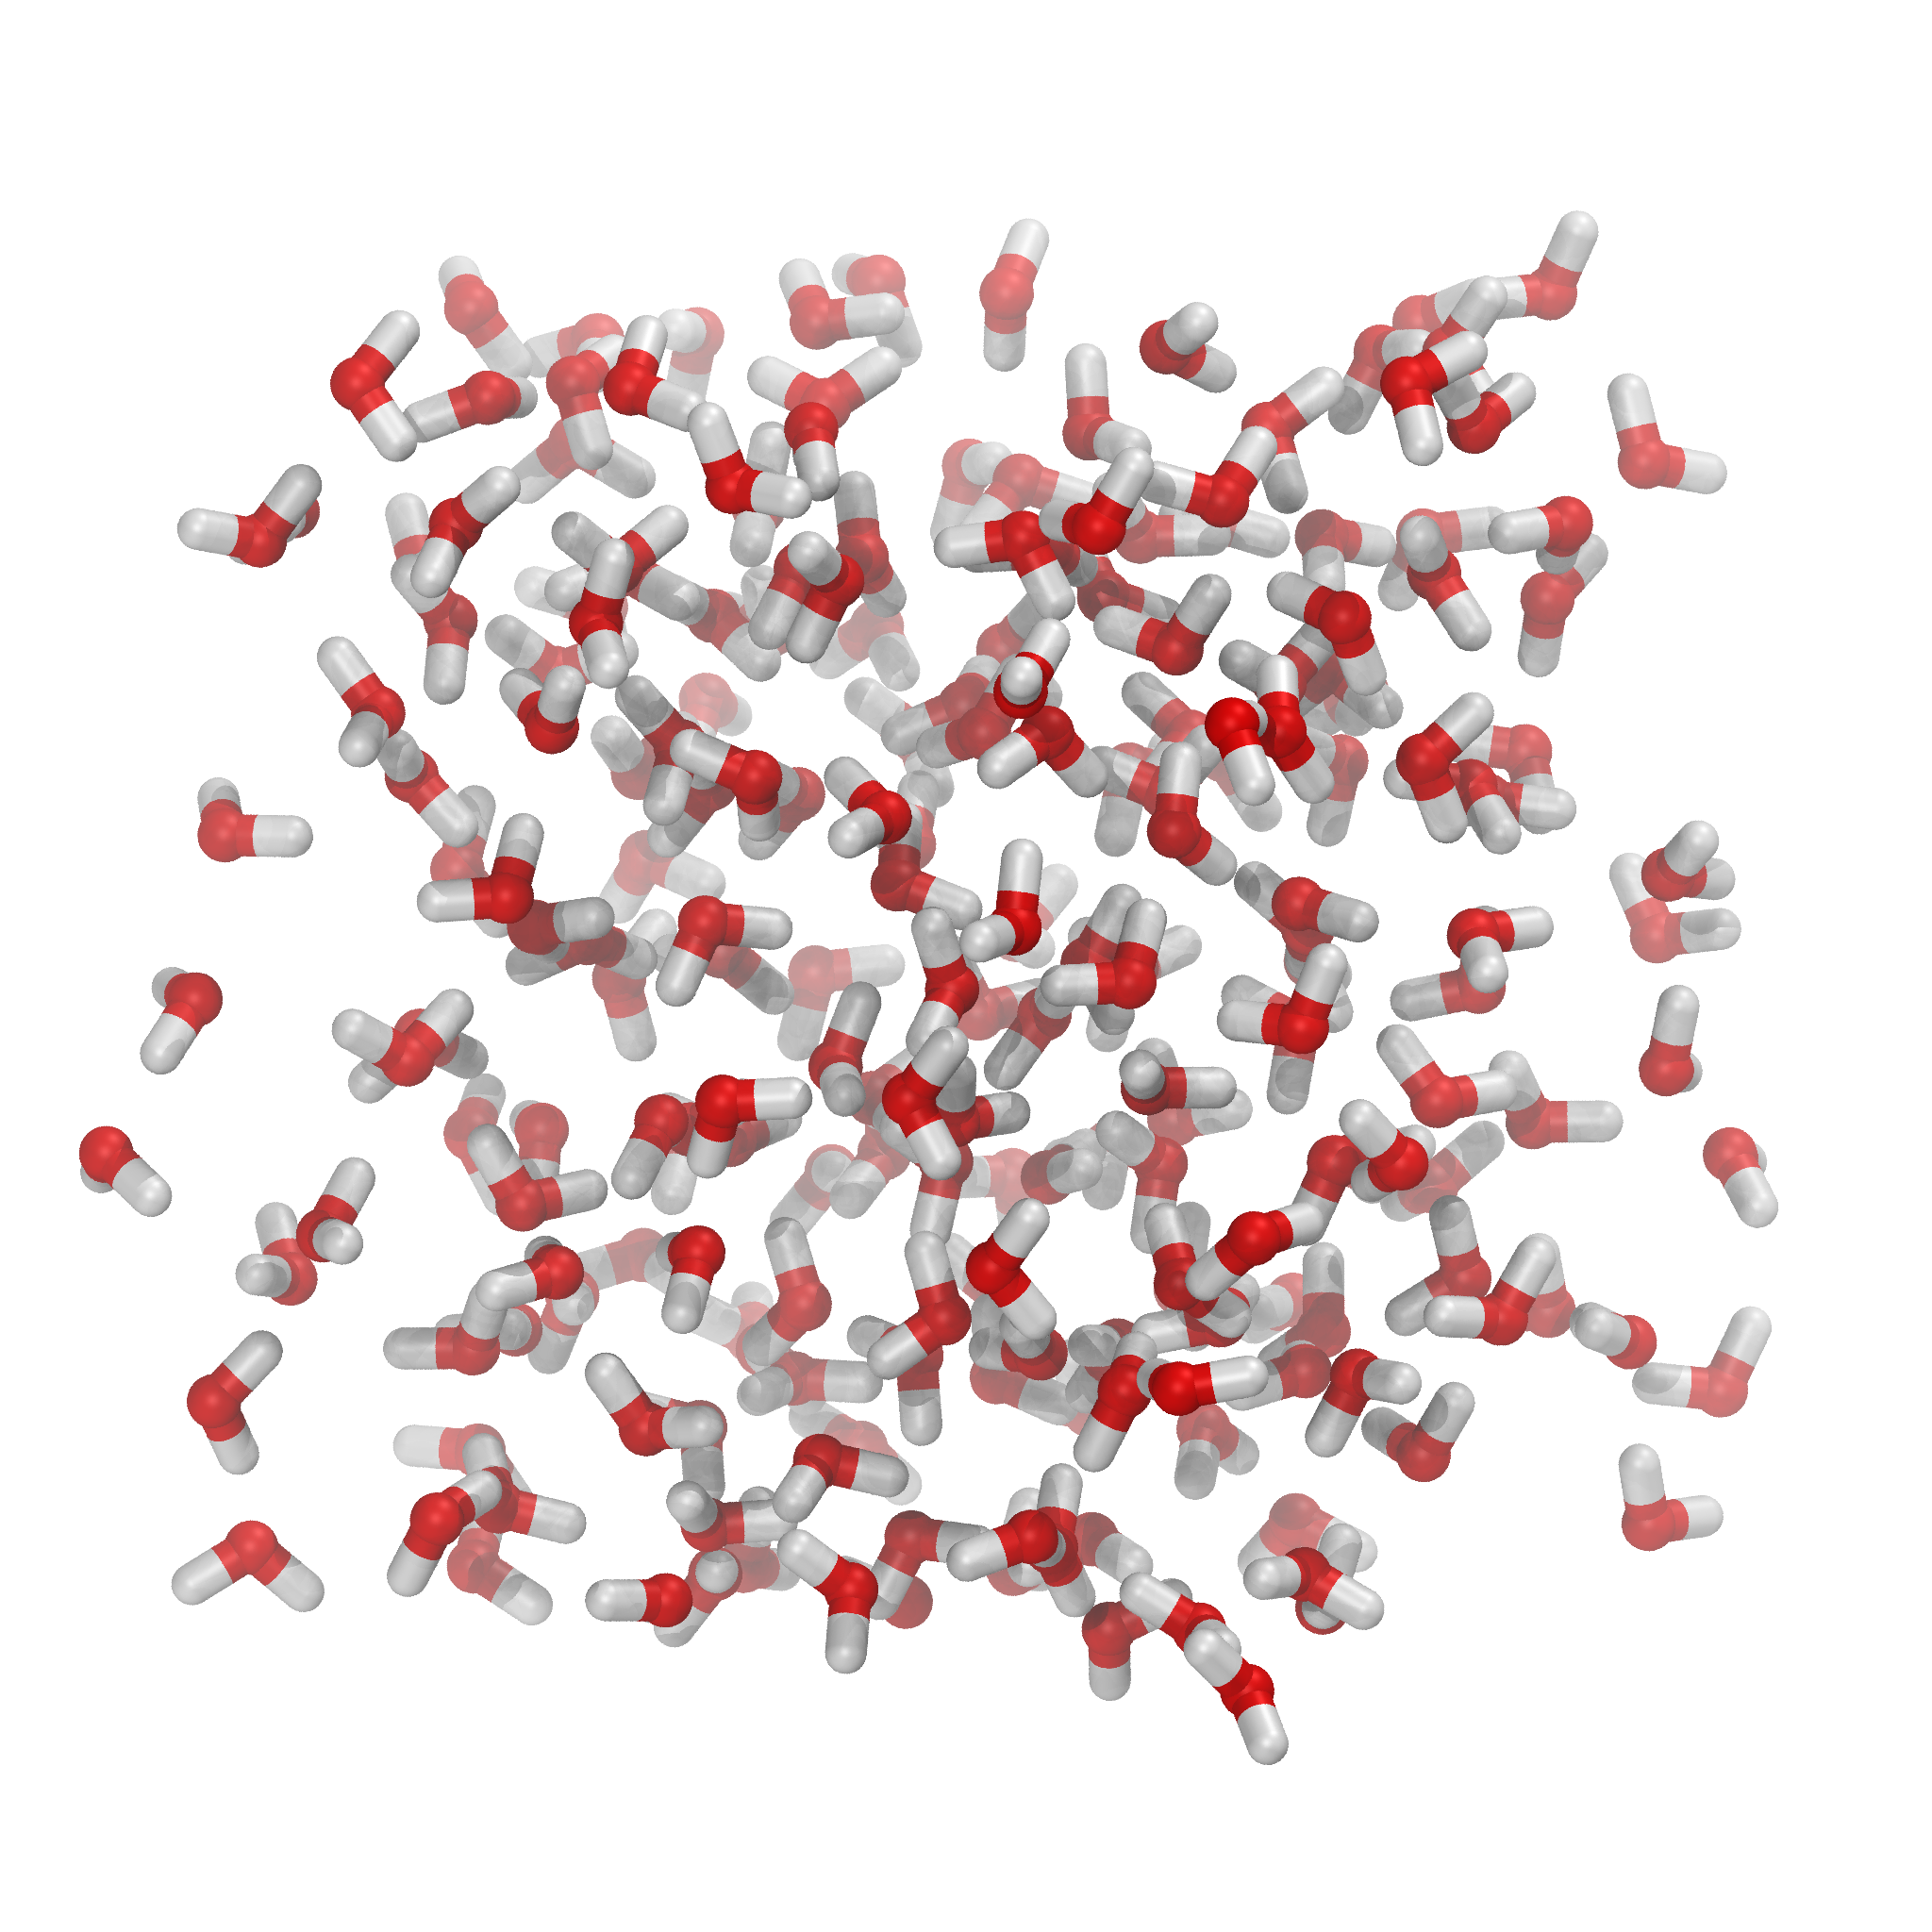
Fig. 14 SPC water molecules using licorice and CPK representations. Traditional red and white coloring.
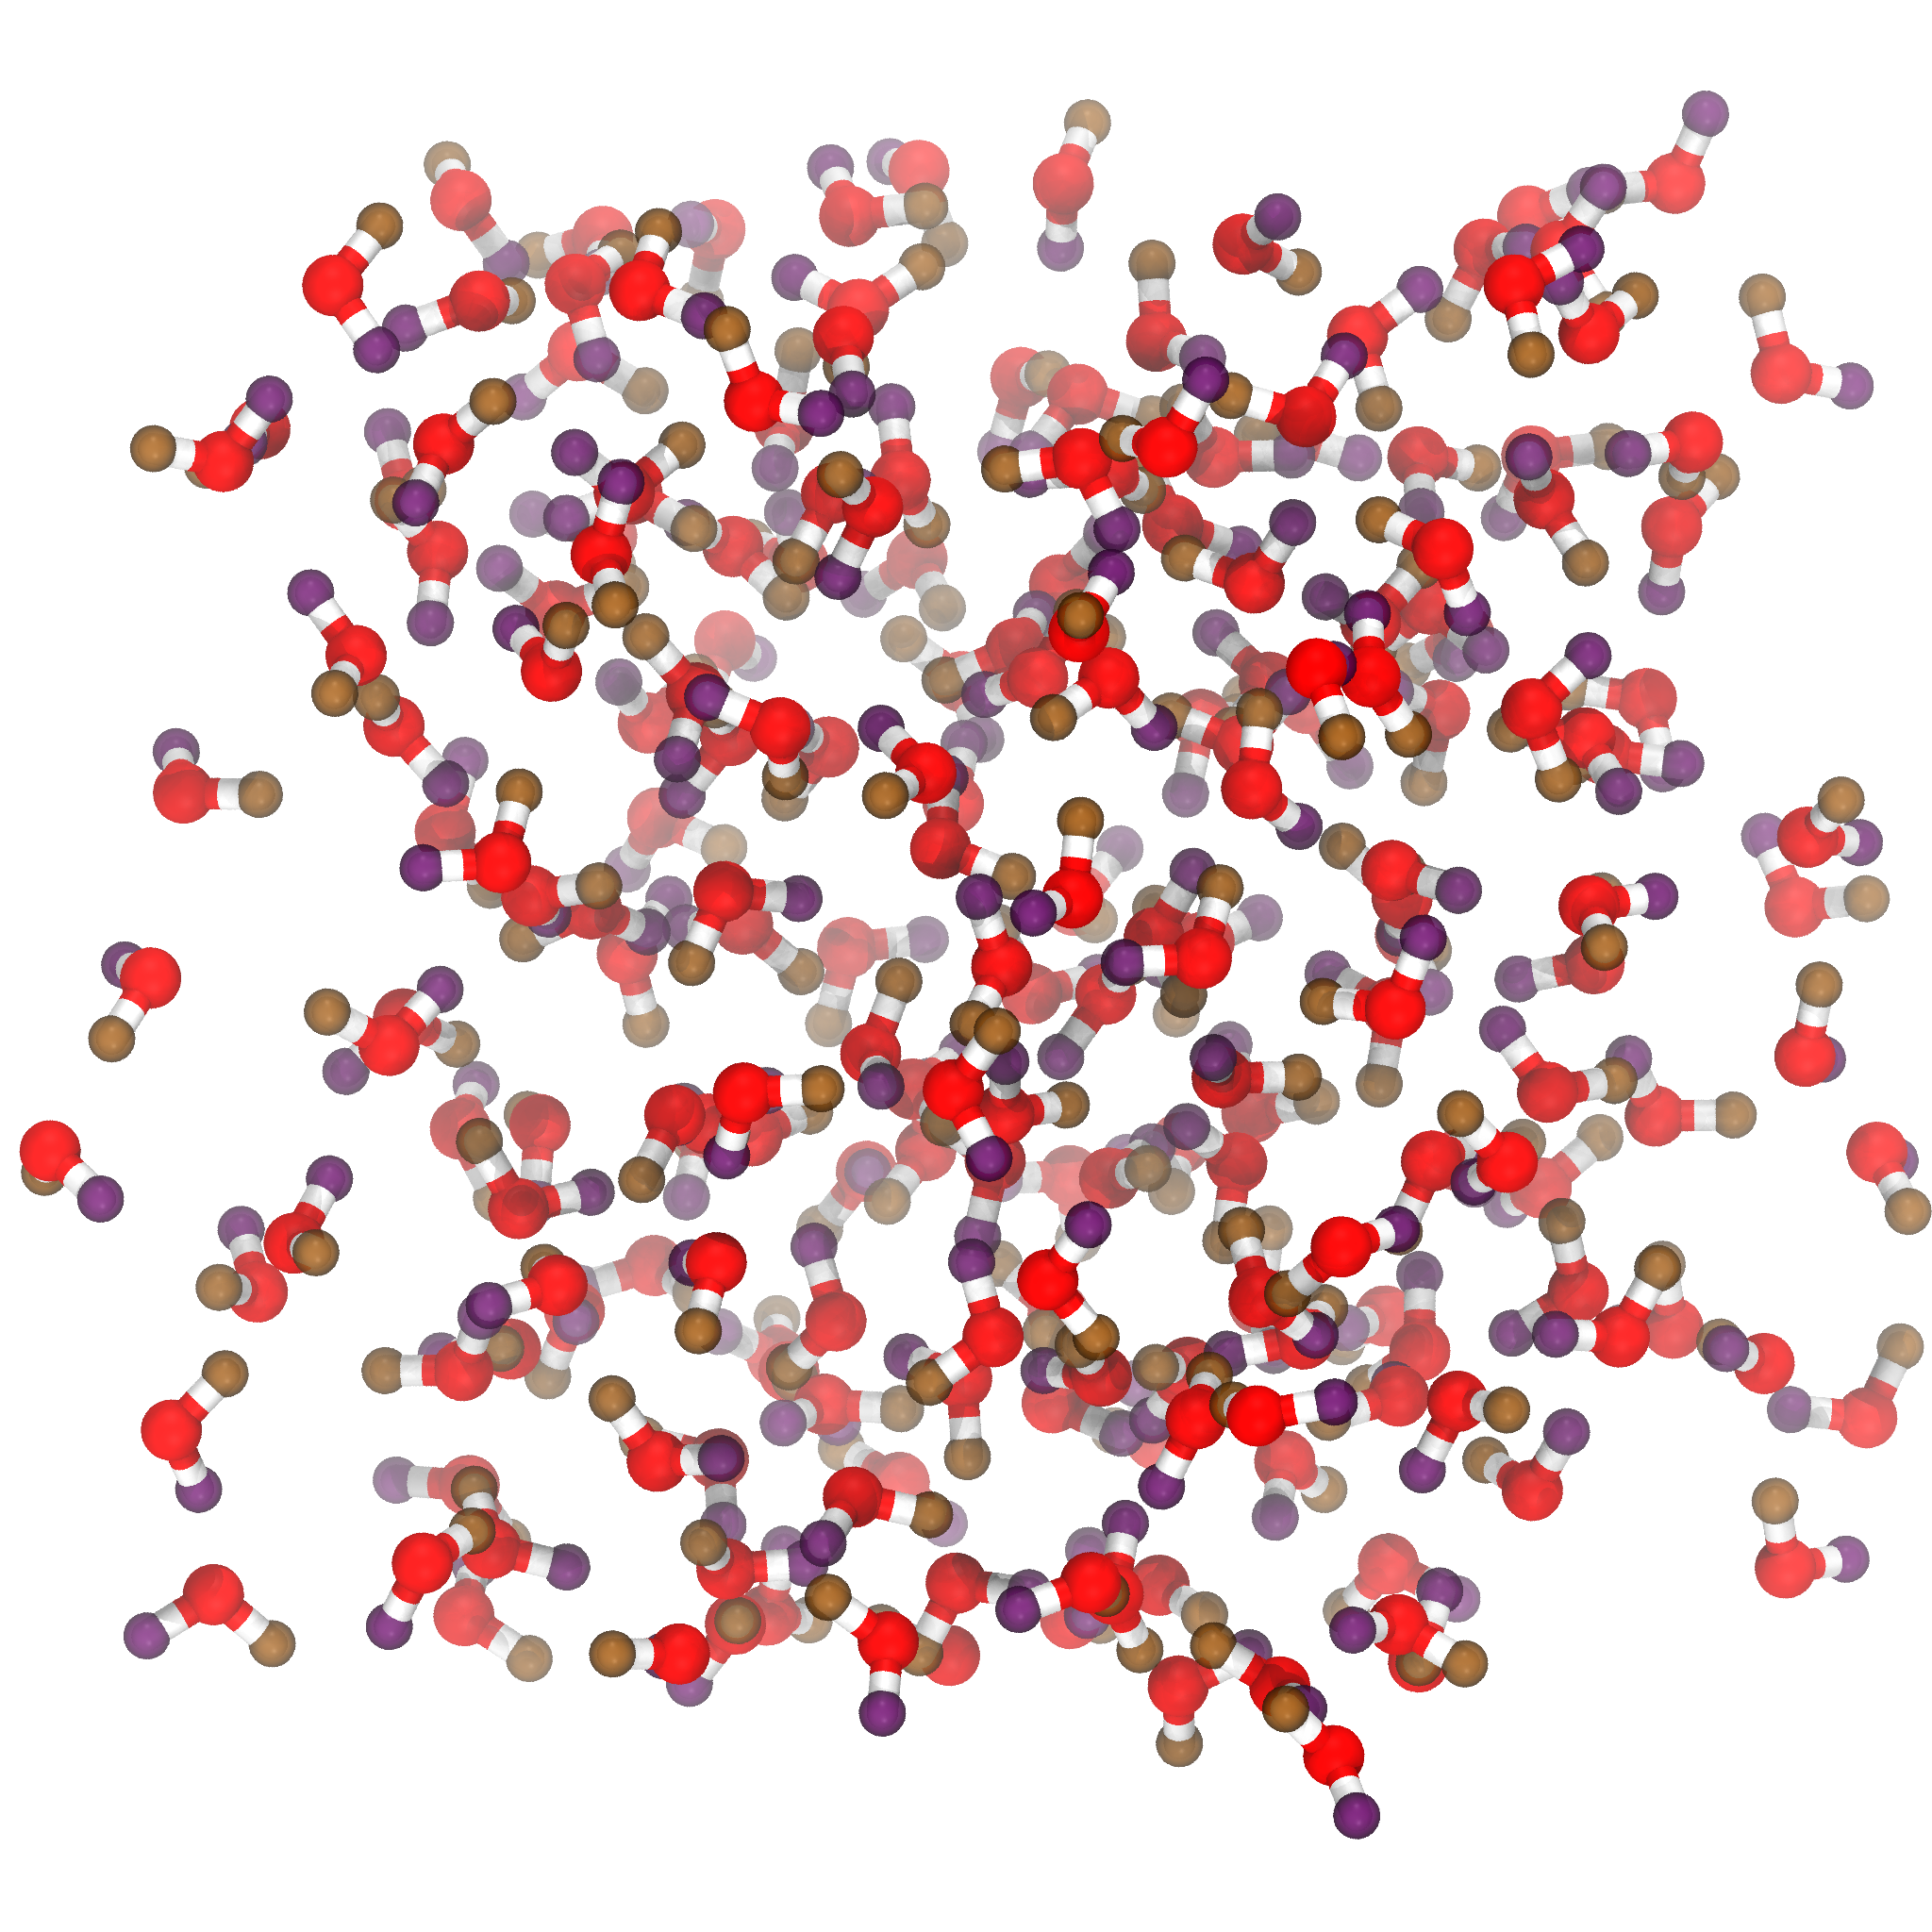
Fig. 15 SPC water molecules with the two hydrogens (HW1 and HW2) shown in different colors.
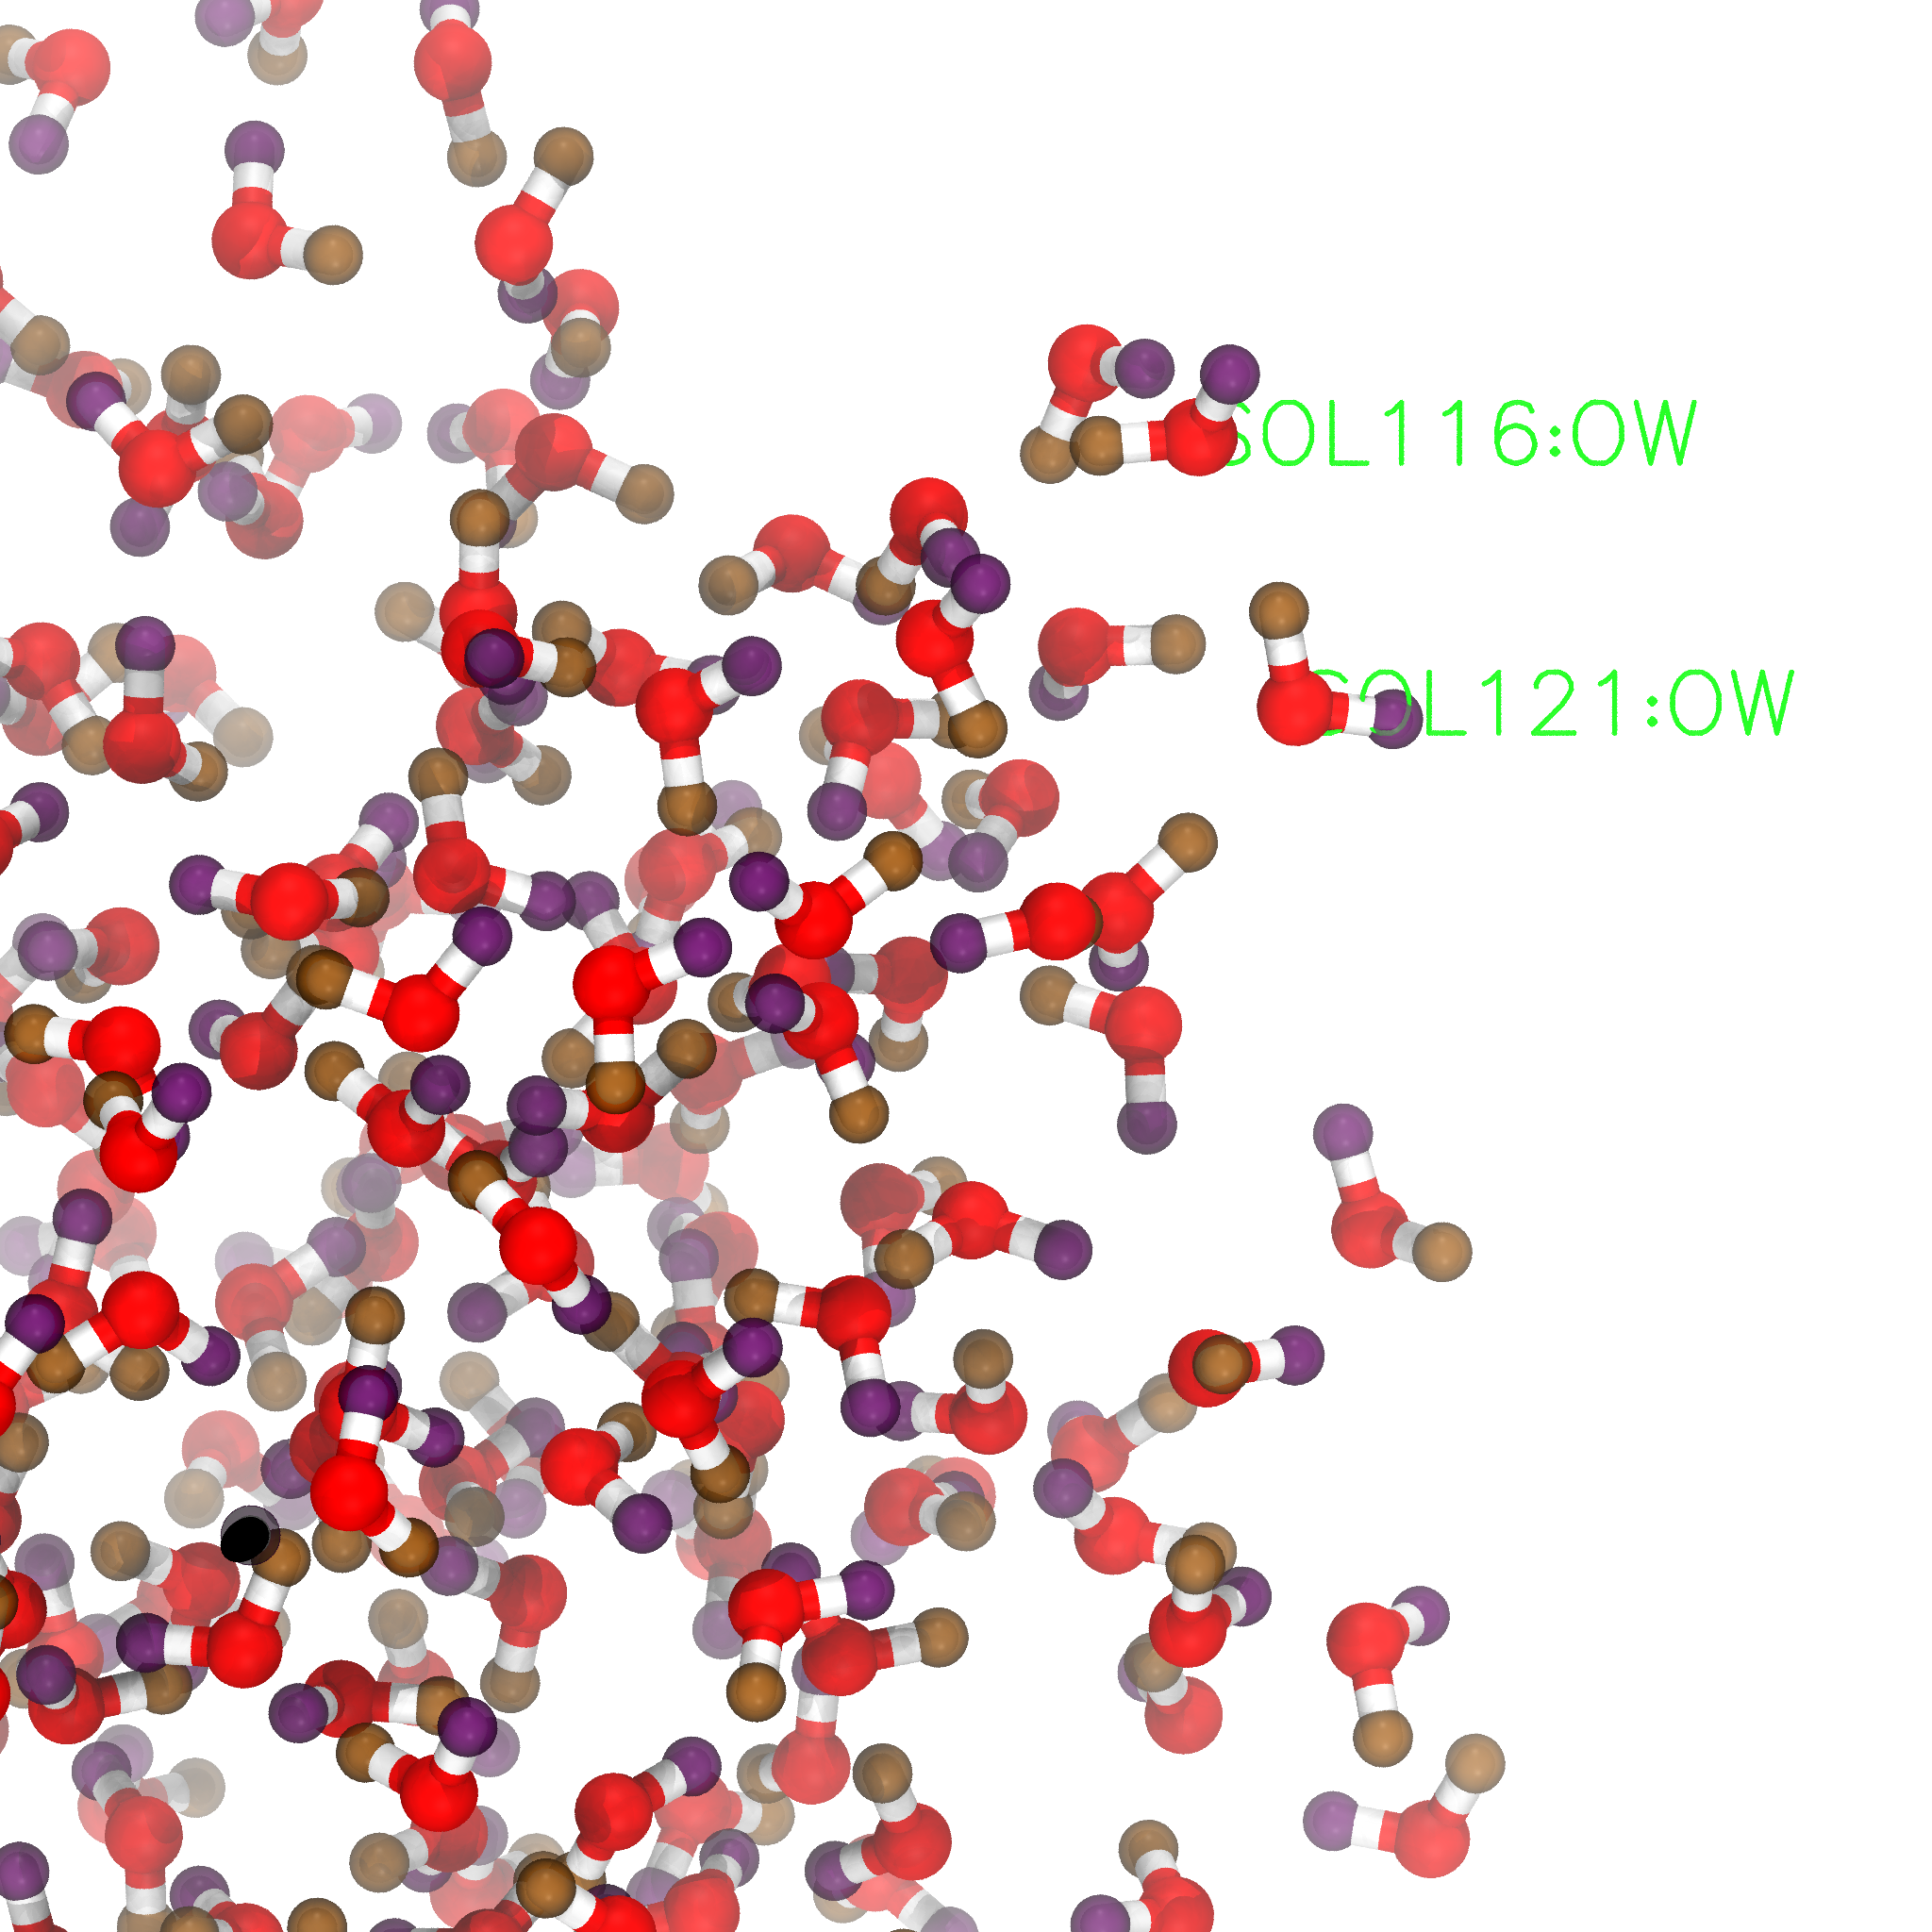
Fig. 16 SPC water molecules with a couple of labels. The two hydrogens (HW1 and HW2) are shown in different colors.
DMPC bilayer
DMPC bilayer with 128 lipids
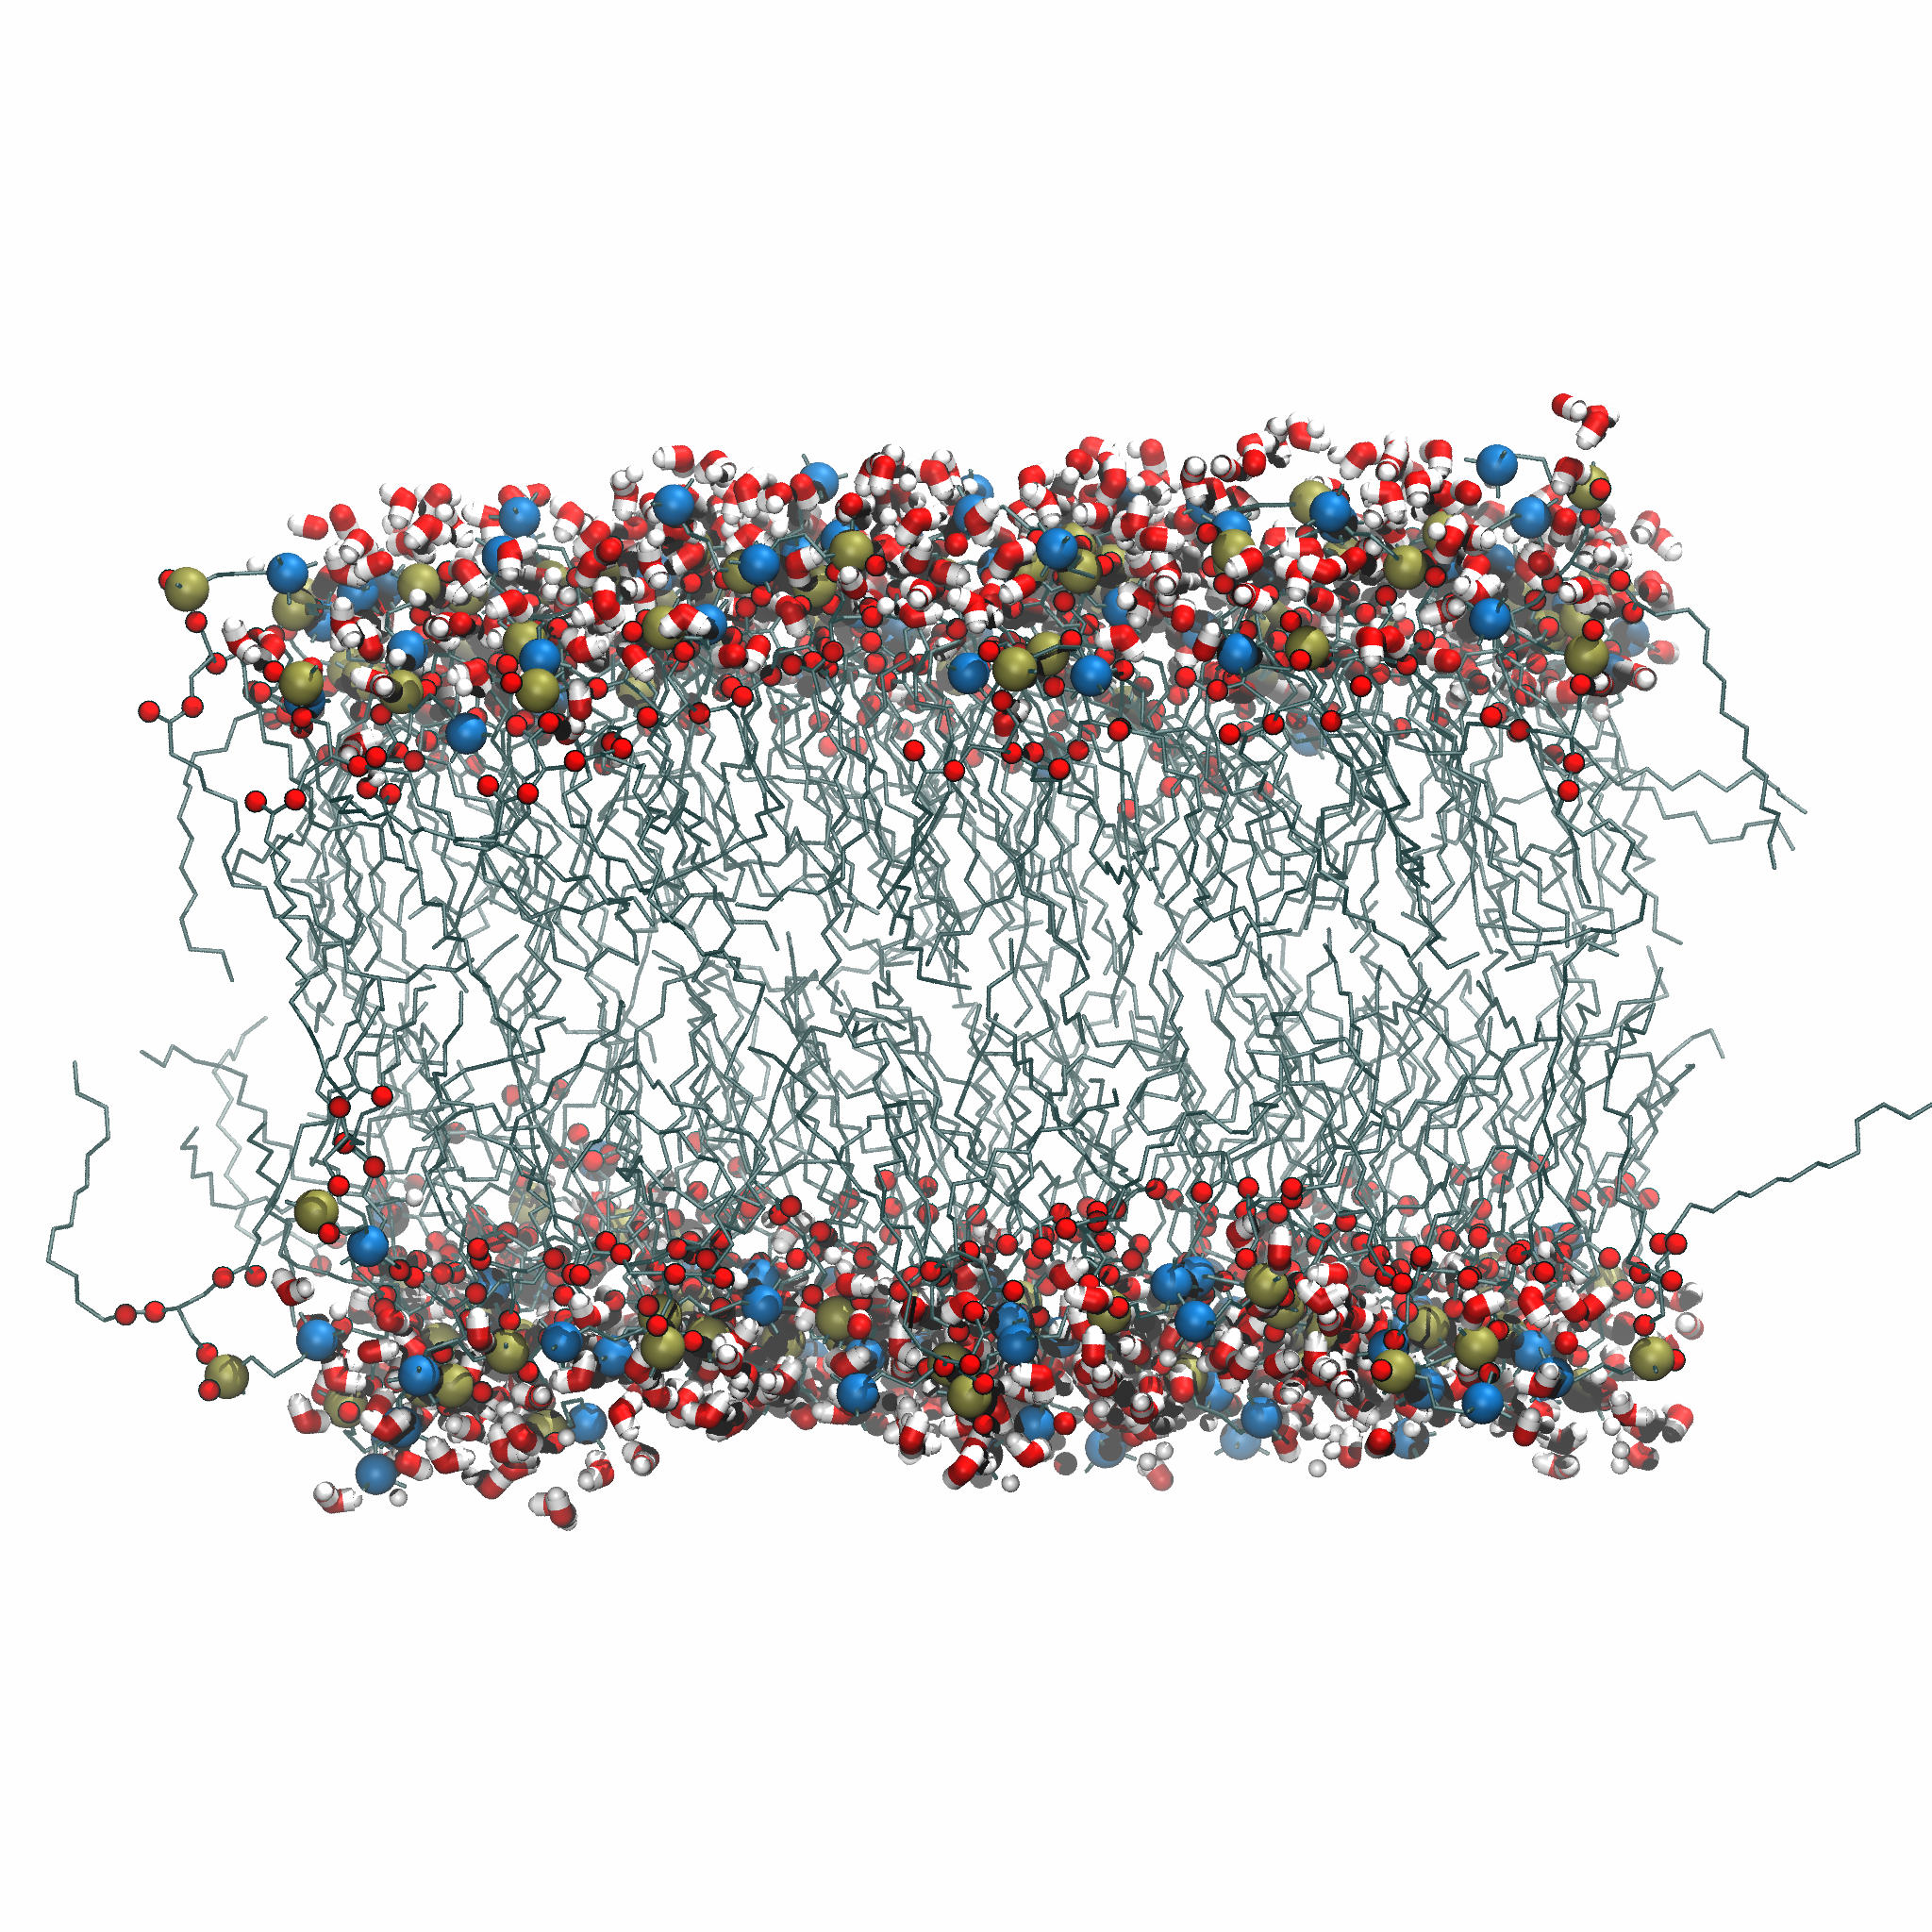
Fig. 17 DMPC bilayer with 128 lipids. Tails, headgroup P and N, and oxygens are shown with different colors and representations. Water molecules closer than 0.5 nm from the P atom are shown.
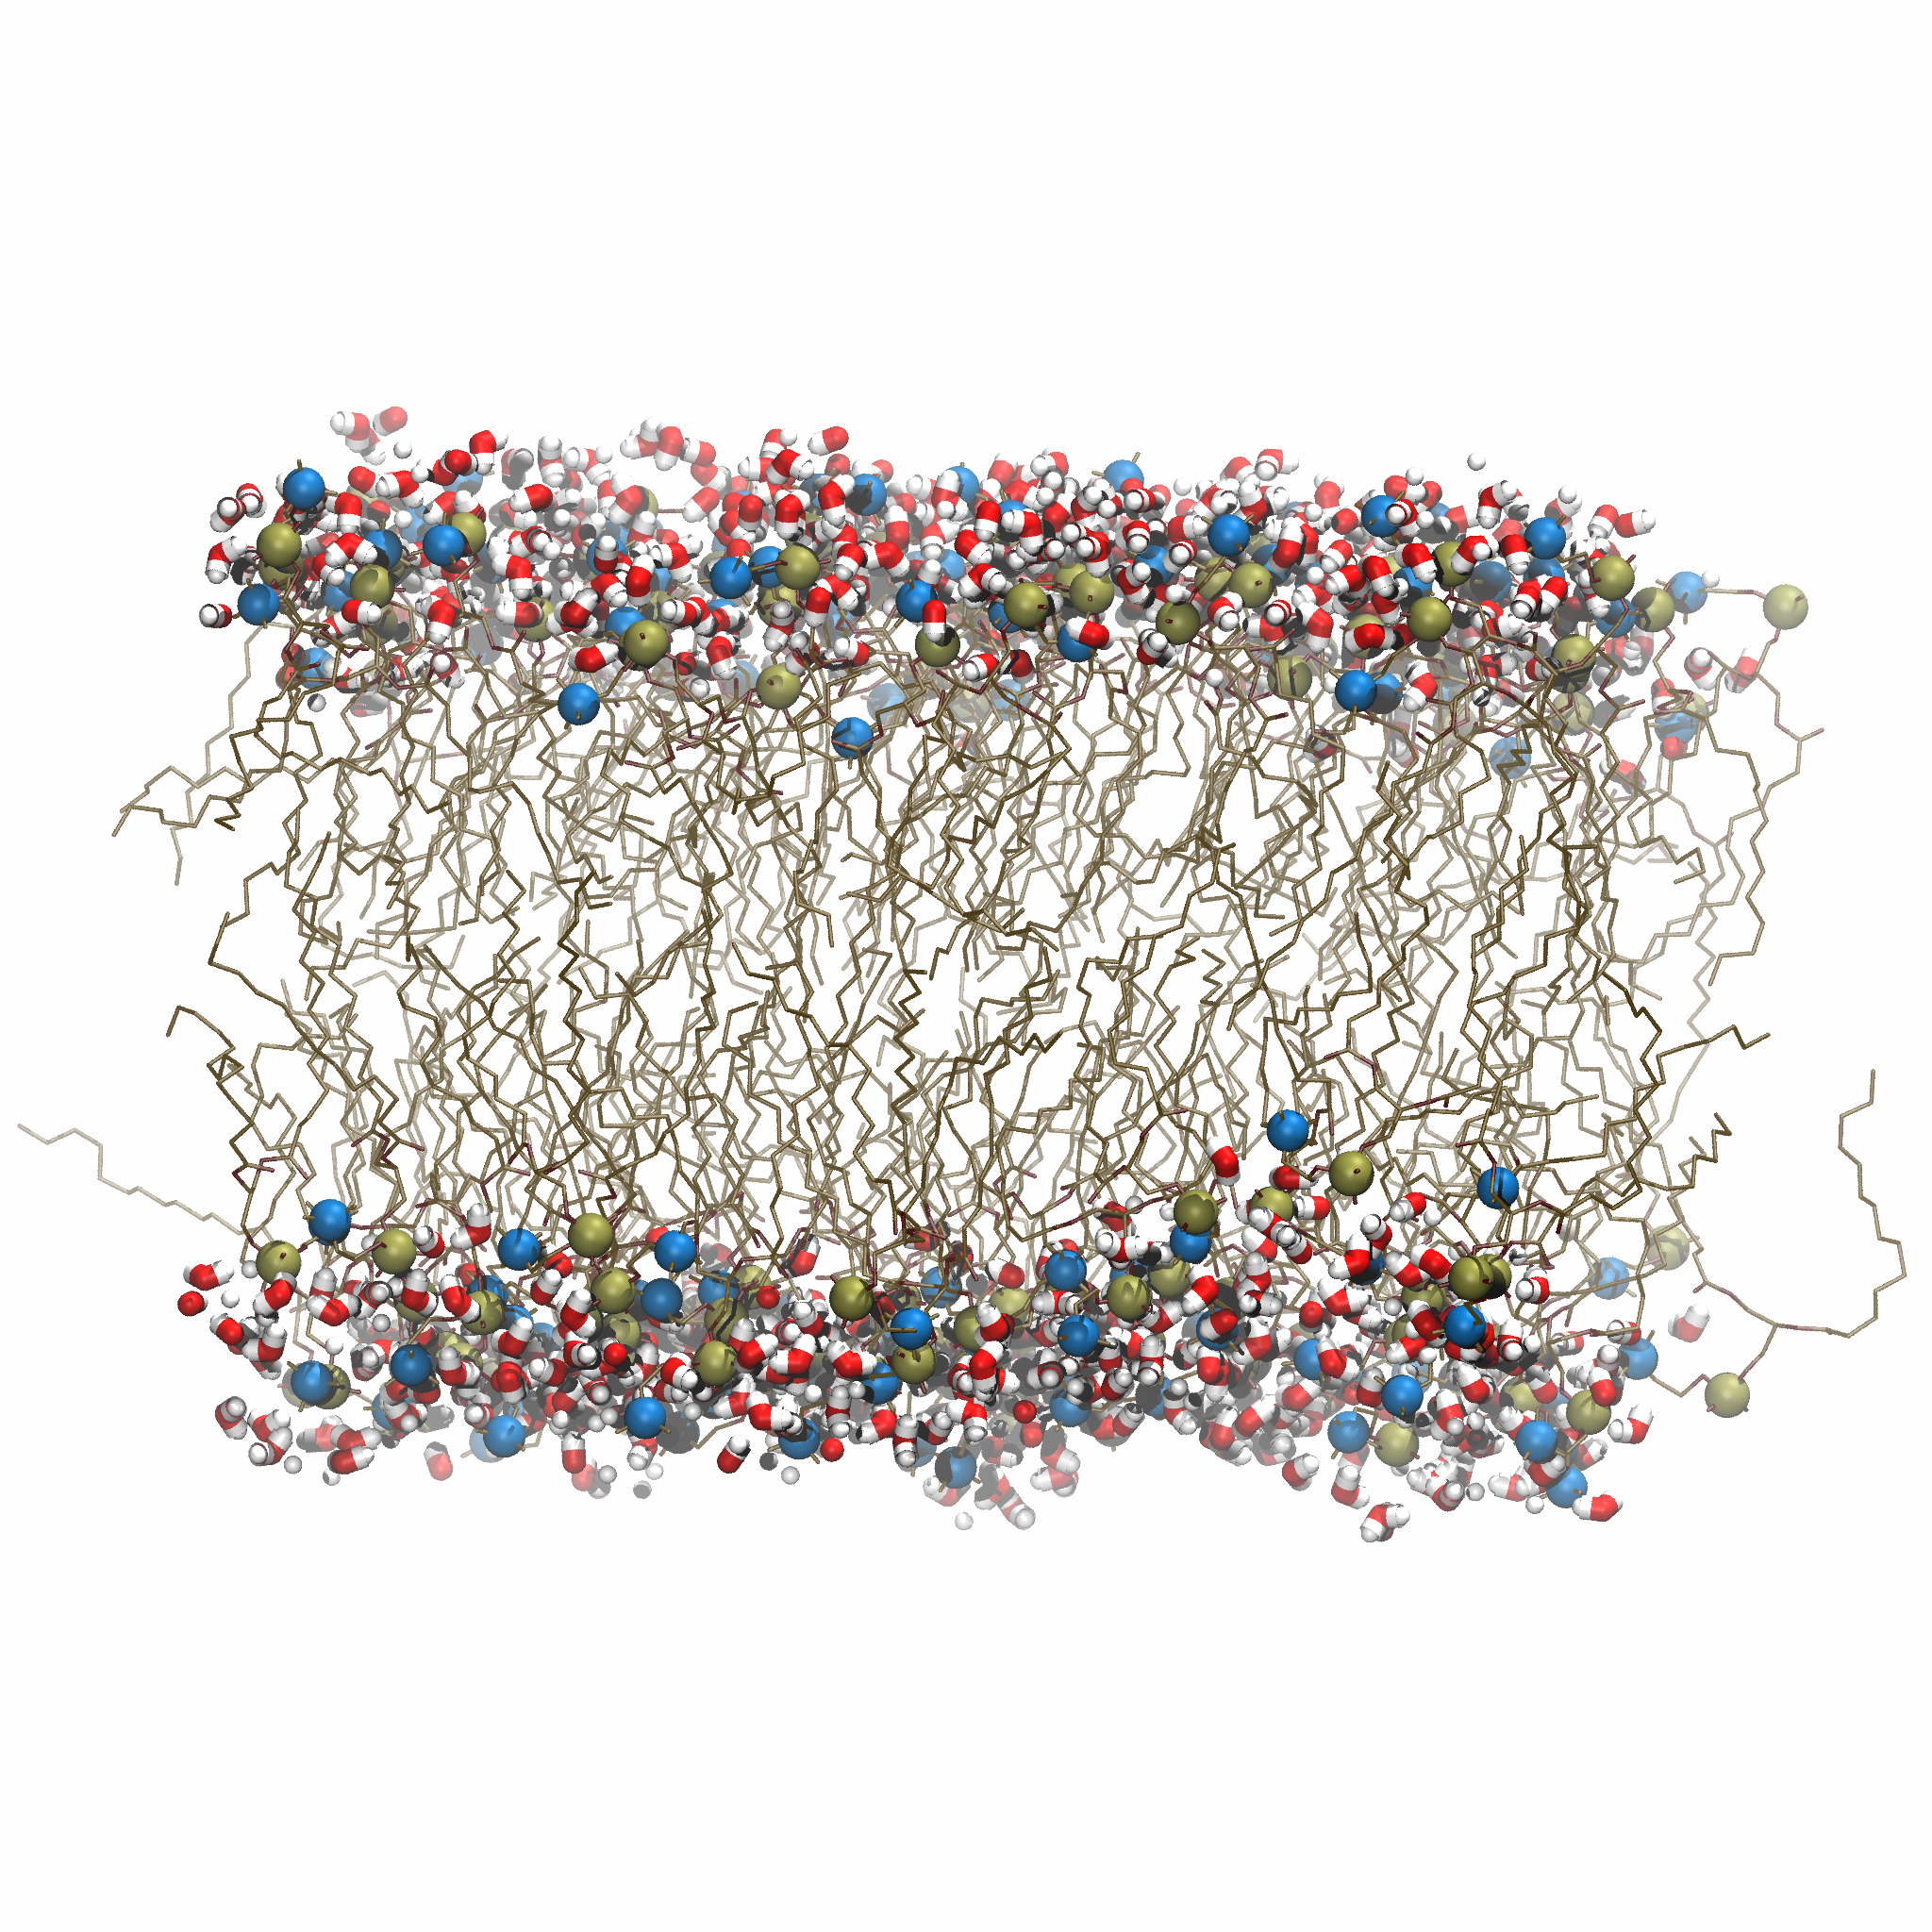
Fig. 18 DMPC bilayer with 128 lipids. Tails, headgroup P and N, are shown with different colors and representations. Water molecules closer than 0.5 nm from the P atom are shown.
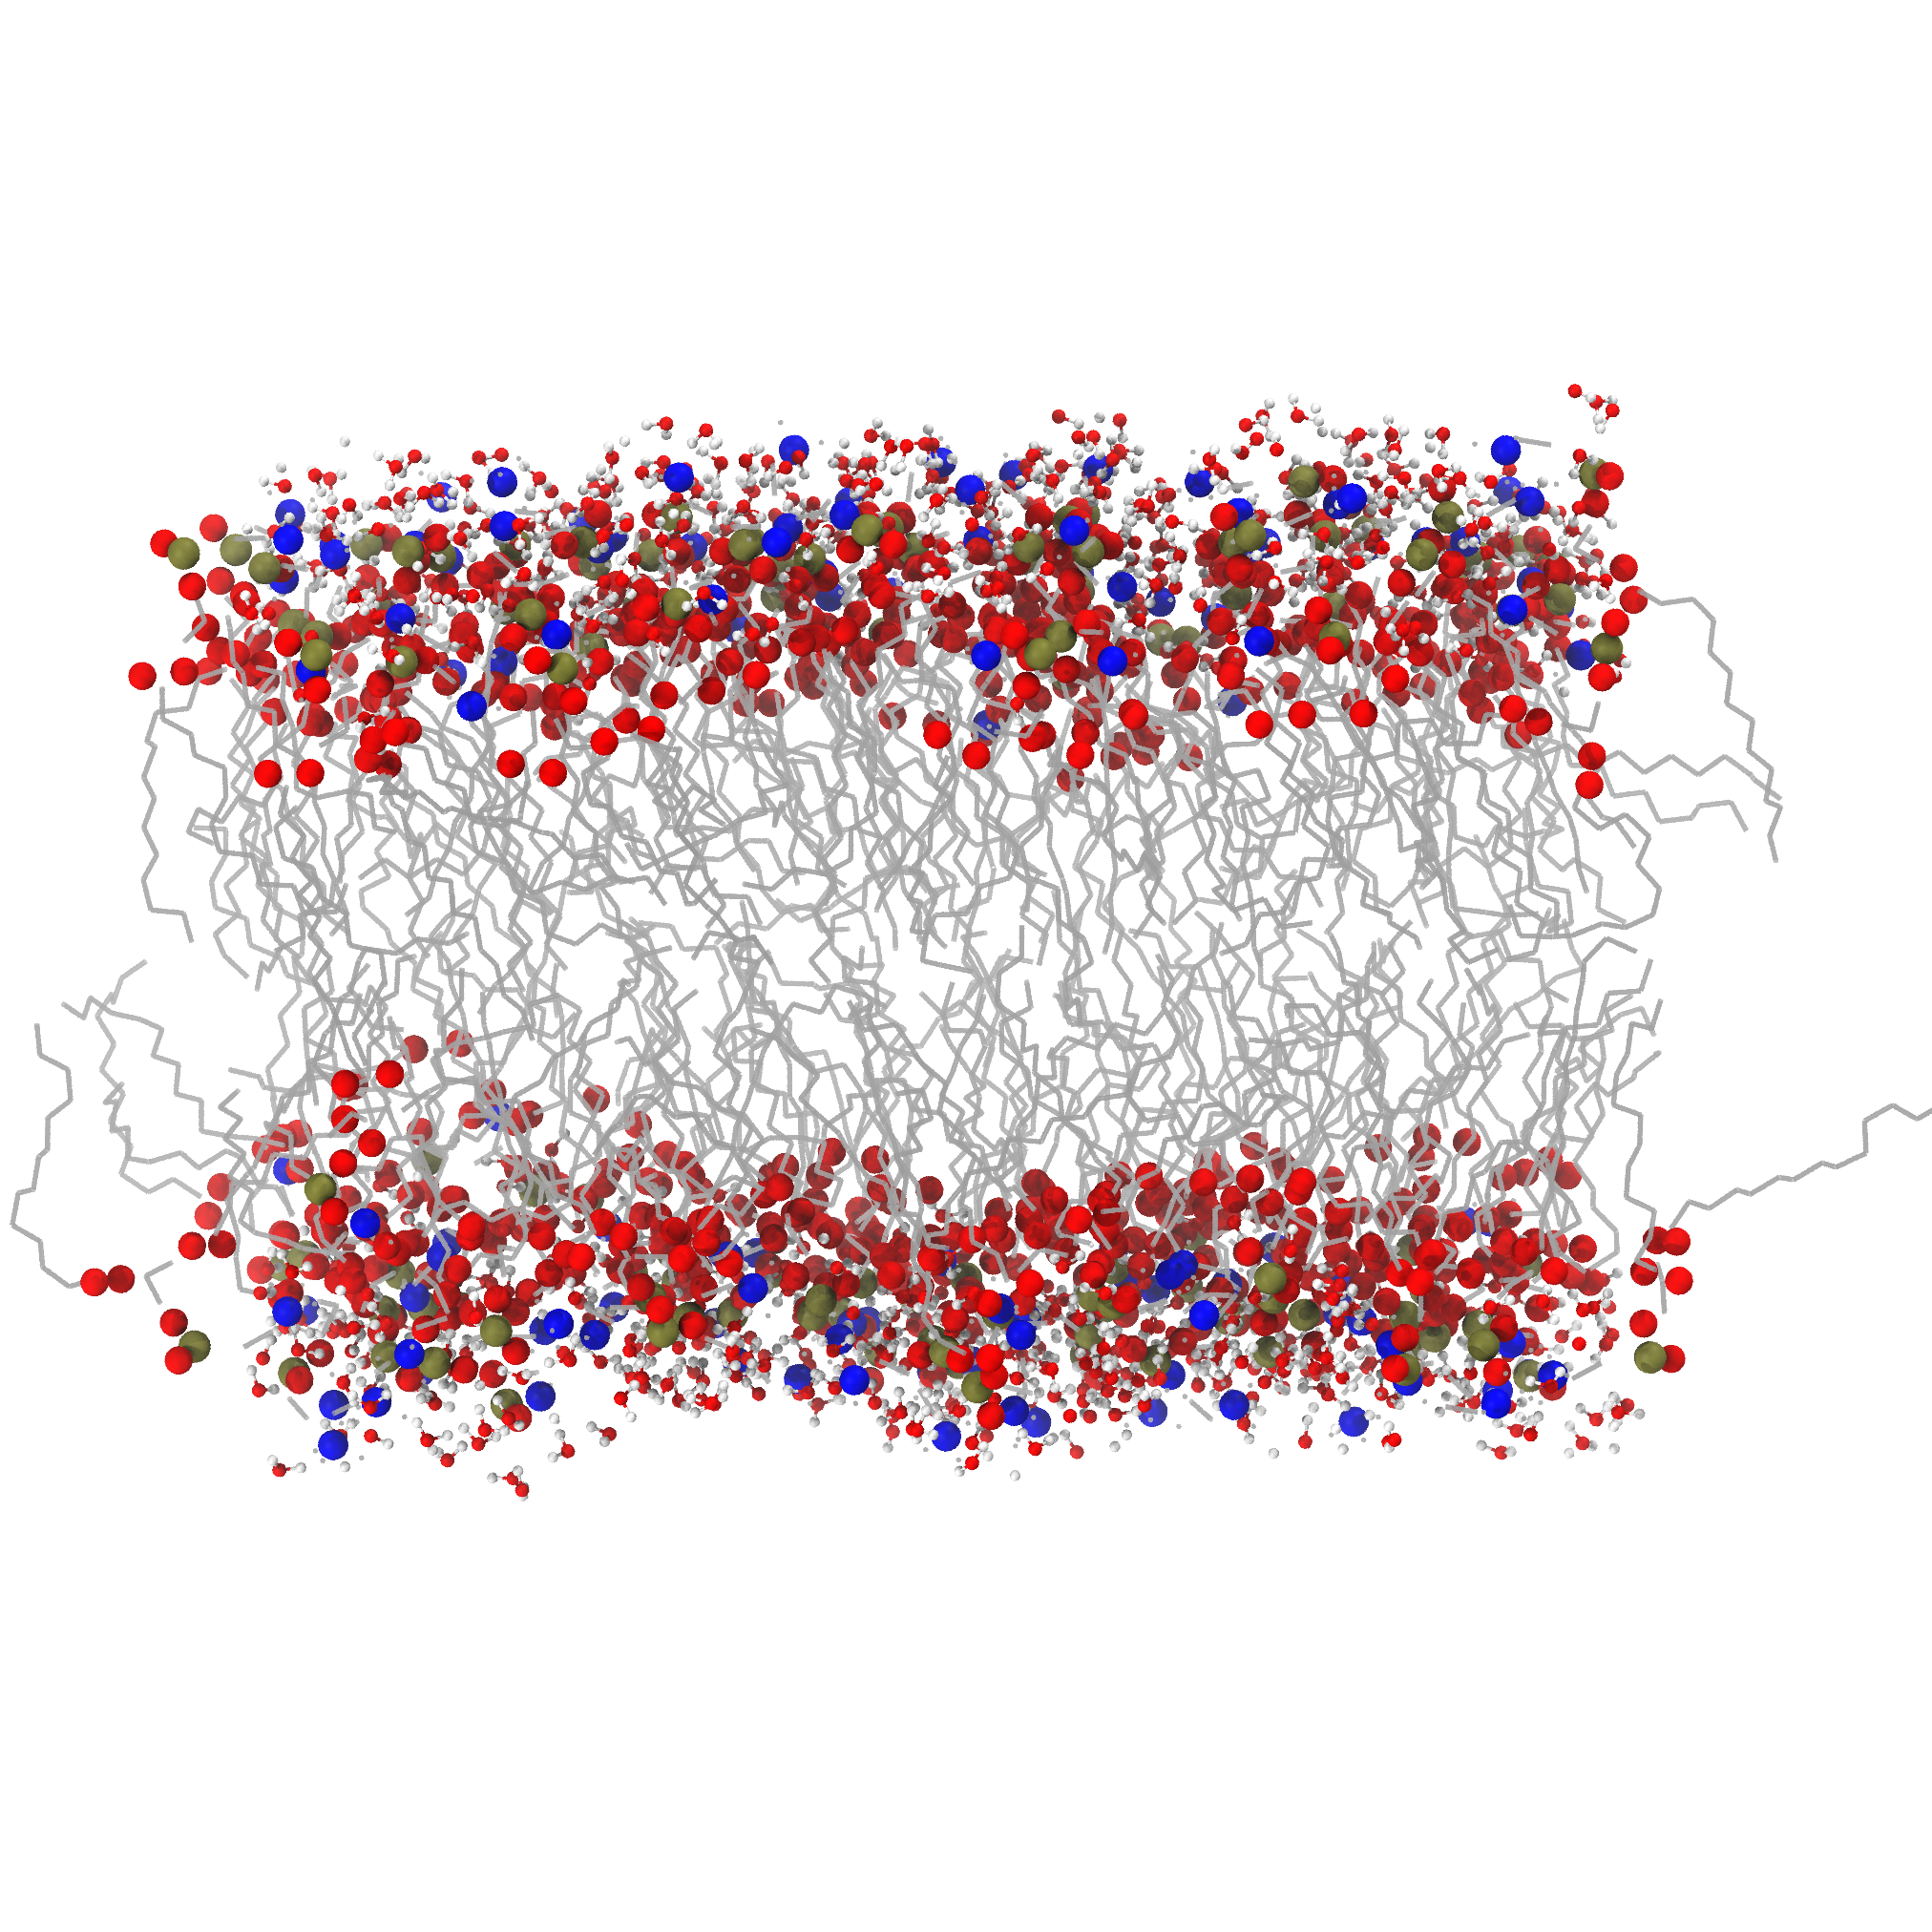
Fig. 19 DMPC bilayer with 128 lipids. Tails, headgroup P and N, and oxygens are shown with different colors and representations. Water molecules closer than 0.5 nm from the P atom are shown.
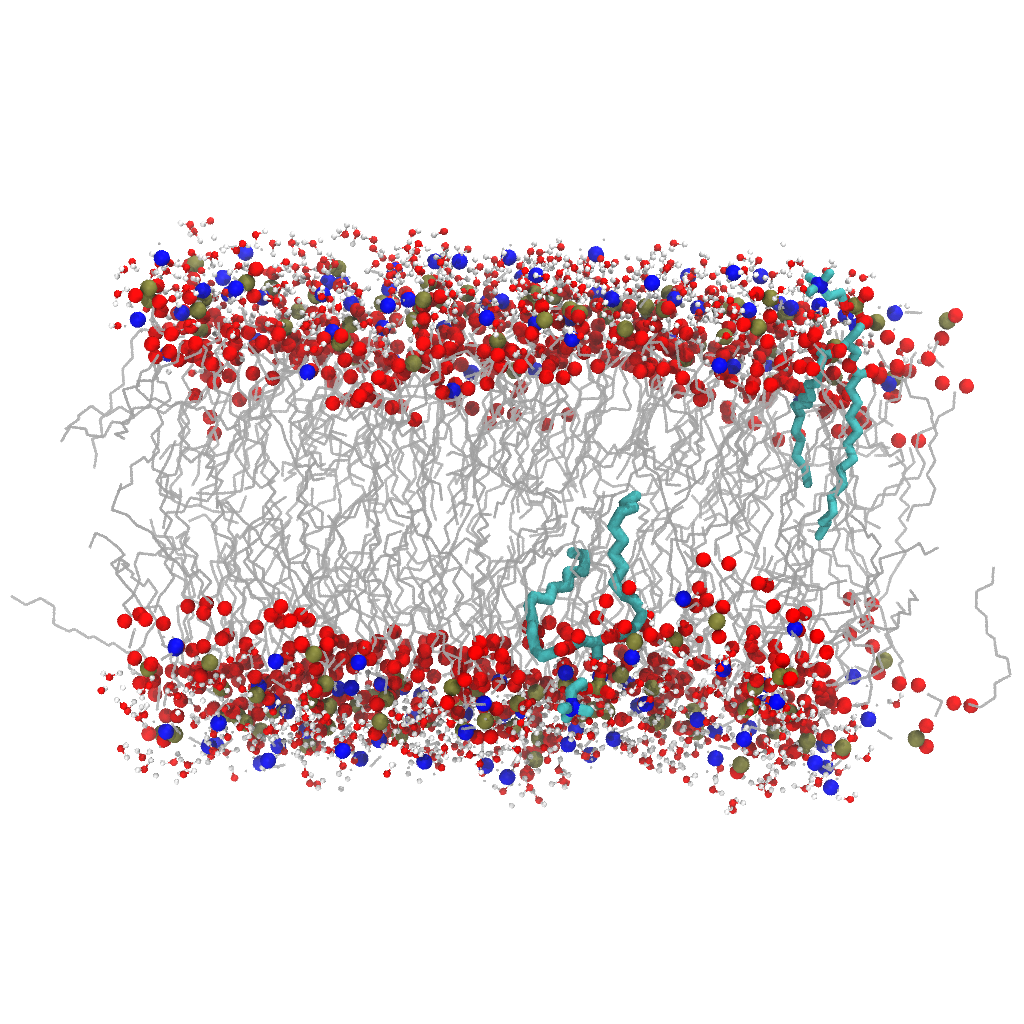
Fig. 20 DMPC bilayer with 128 lipids. Tails, headgroup P and N, and oxygens are shown with different colors and representations. Water molecules closer than 0.5 nm from the P atom are shown. One DMPC in each of the leaflets is shown in licorice
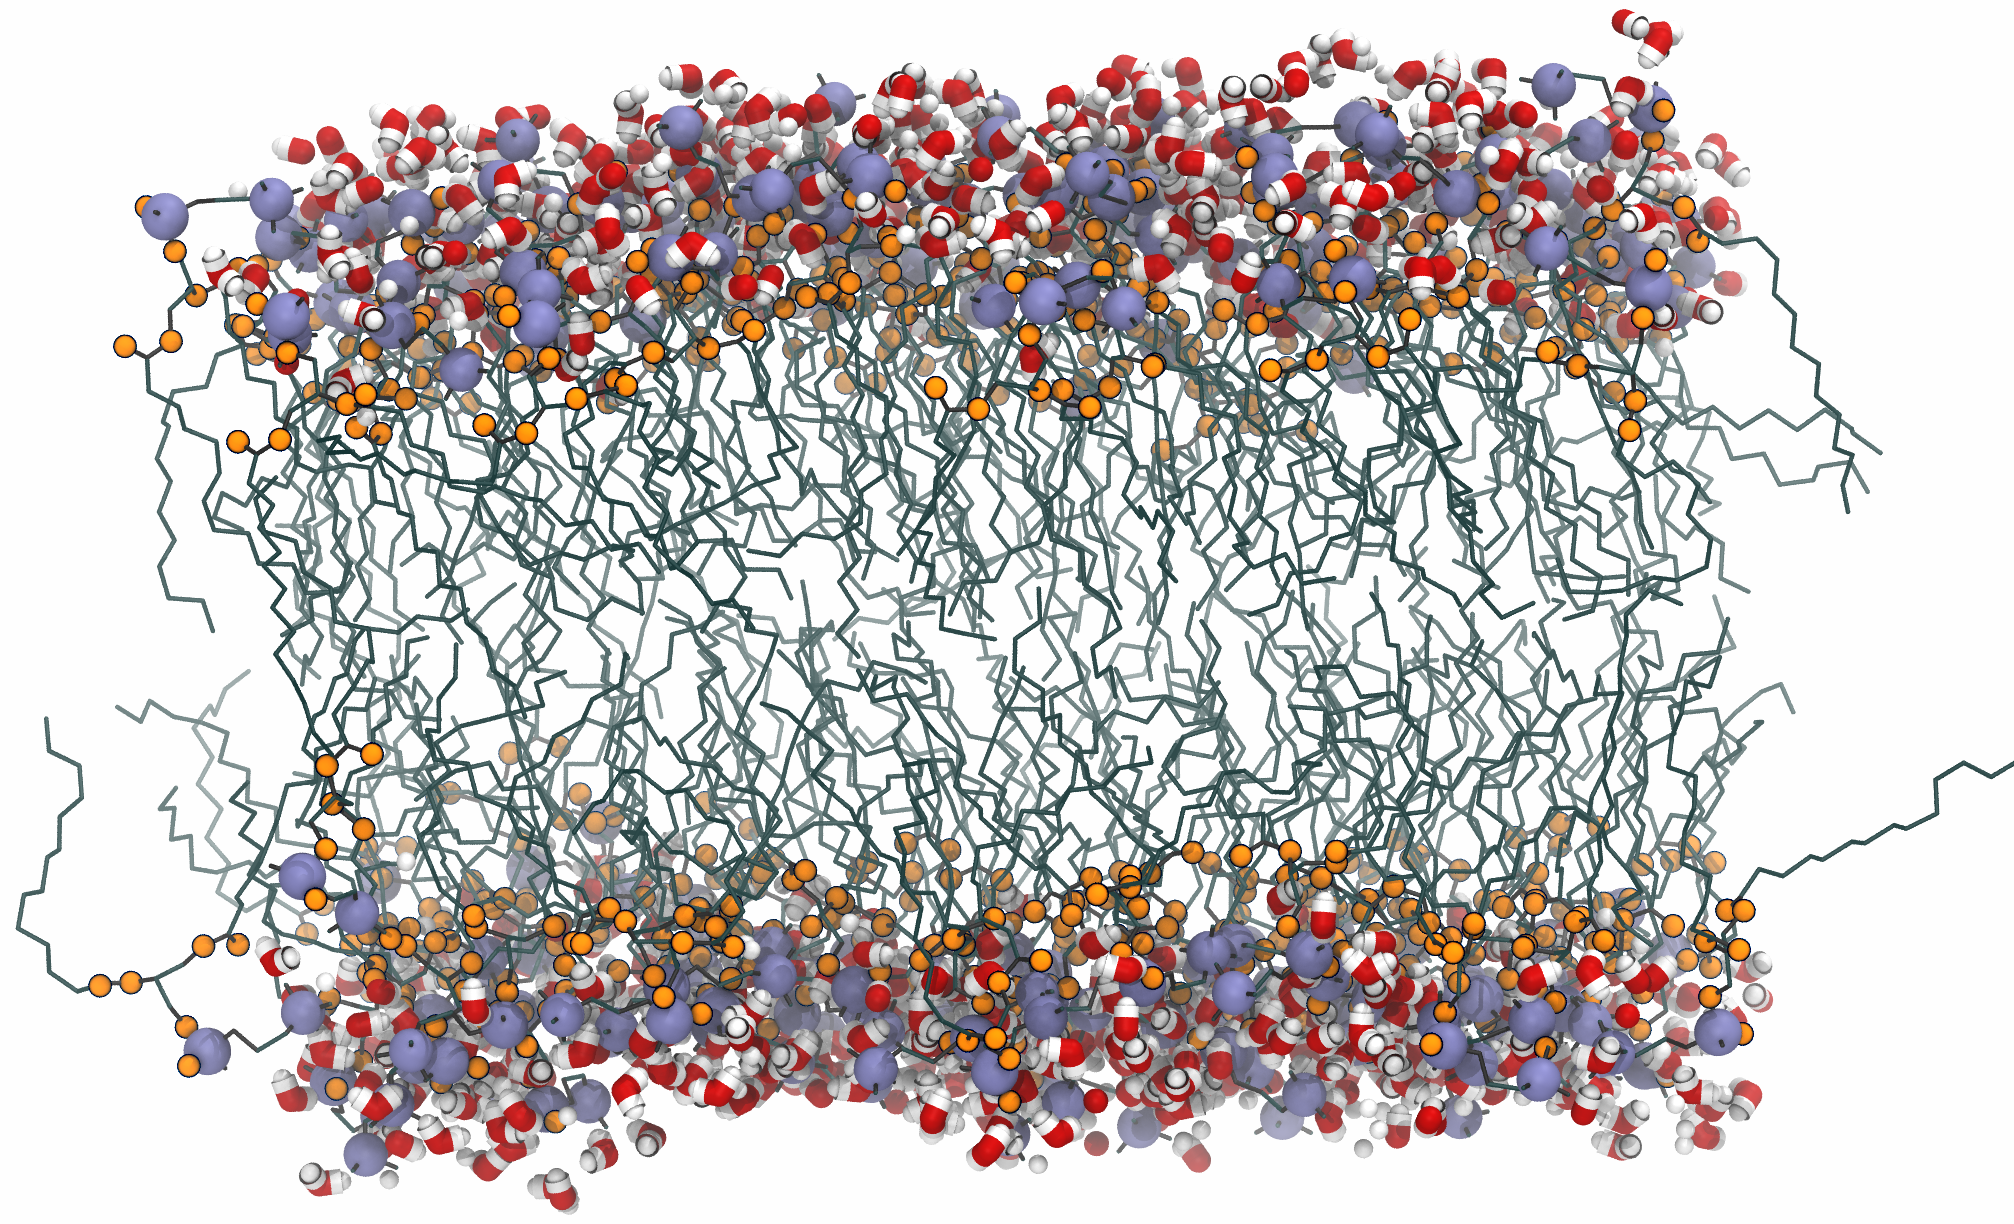
Fig. 21 DMPC bilayer with 128 lipids. Tails, headgroup P and N, and oxygens are shown with different colors and representations. Water molecules closer than 0.5 nm from the P atom are shown.
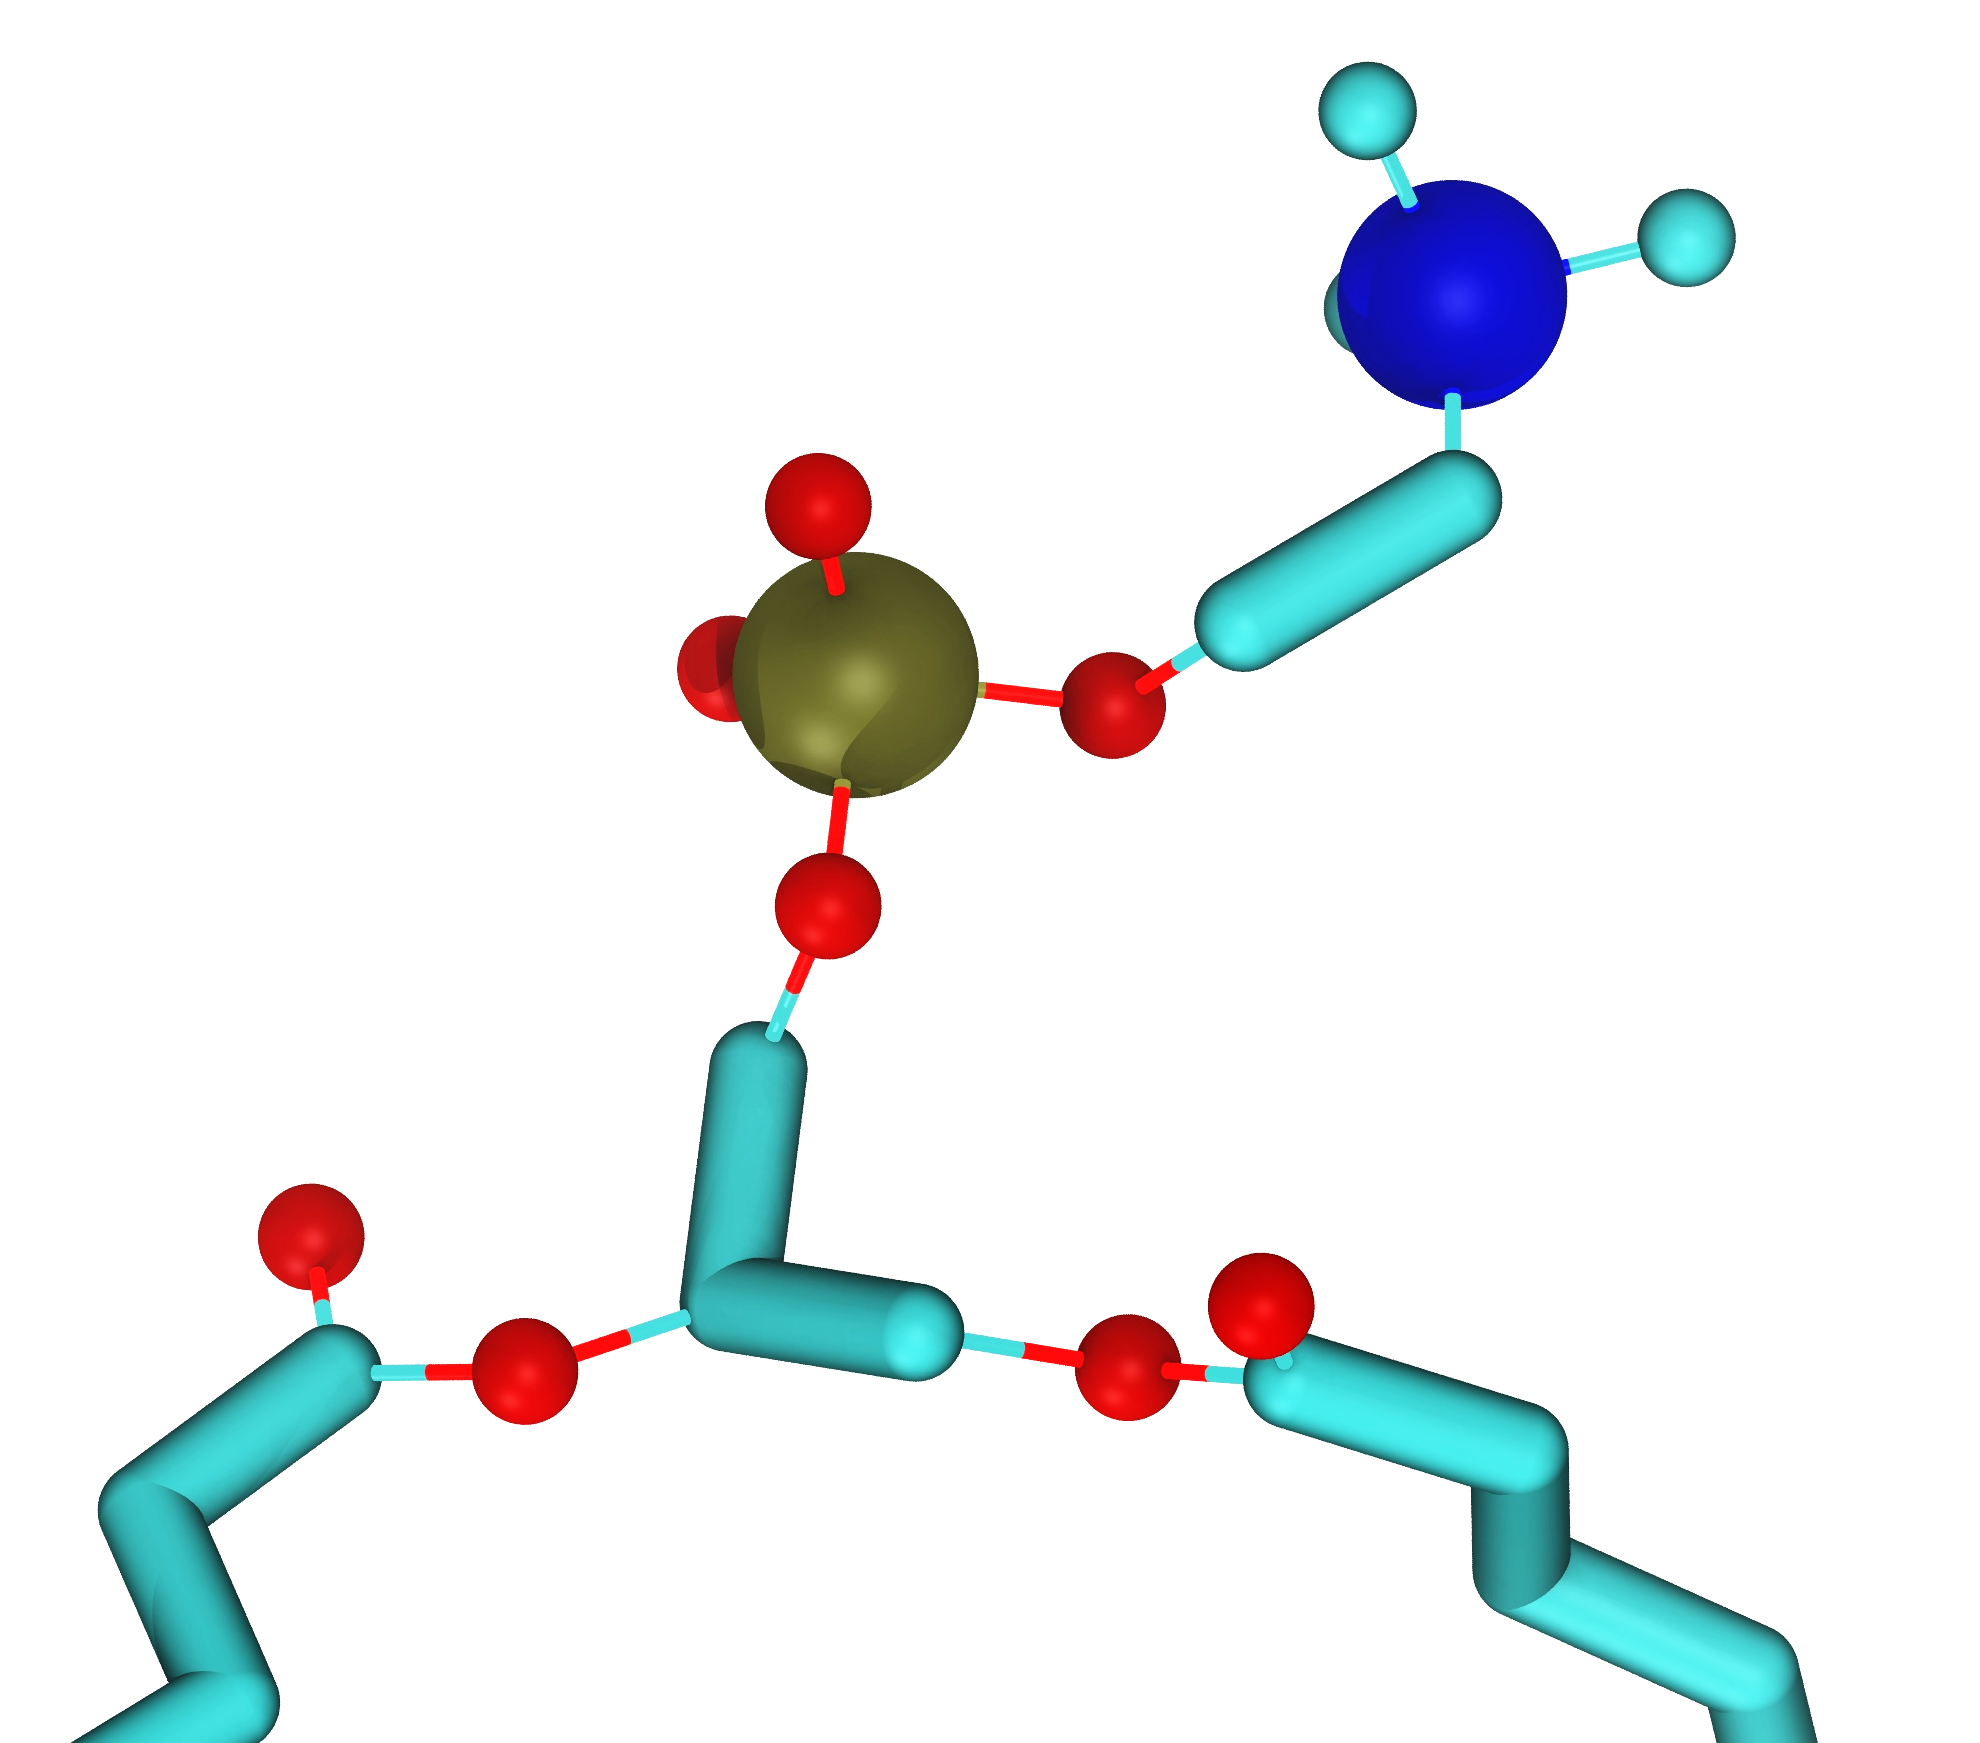
Fig. 22 Headgroup region of a DMPC molecule.