Lab 5: Simulation of lysozyme, part 1/2
Learning goals:
To learn how to set up a simple protein simulation
To learn how to handle files from the PDB database, and fix some of the problems they have
To understand what position restraints are
Keywords: Gromacs, molecular dynamics, protein, lysozyme, ions, PDB, topology, position restraints, crystal waters, missing atoms
Related material:
This lab is based on Dr. Justin Lemkuhl’s tutorial lysozyme in water
Dr. Bert de Groot Introduction to protein simulations
Rizzo Lab, Stony Brook. Protein (ubiquitin) in Water.
Preliminary: Create yourself a work directory
Create a work directeory under the course directory. It is good to give it a descriptive name so that it is easy to find it afterwards.
Step 1: Topology
Step 1.1: The .pdb file: Perform the checks before pdb2gmx
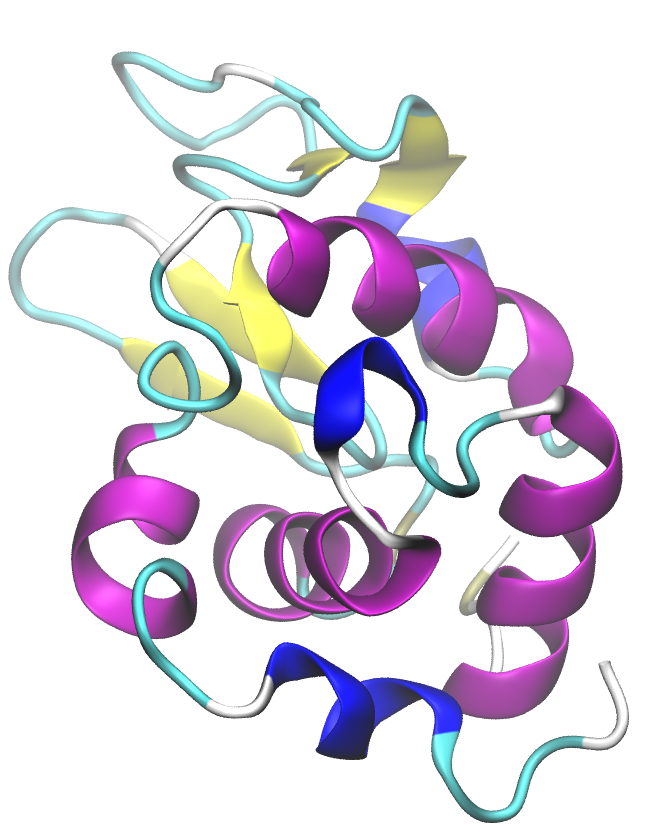
The first step is to select the molecule, in our case a protein called lysozyme, we wish to model.
For the following (and also for all the other file editions) you will need a basic text editor like emacs, vi, notepad, or such. Do not use MS Office or similar. All the files must be in plain text format. Let’s get started:
Download the pdb file 1AKI (
1AKI.pdb) from the PDB Database1AKI is hen white lysozyme. Check what are its the biological importance & functions.
When you have the
.pdbfile, it is good to make a backup copy of it so that you will have the original available in case something goes wrong in the following steps.
Now that we have the molecule, we must perform some basic checks to see if the file is complete or if it is missing some atoms. Why would the file be missing some atoms? Typically, the structures in the pdb database have been obtained using (x-ray) scattering or NMR. While scattering has very high resolution, it cannot always resolve all the atoms due to reasons such as lack of contrast (question: what is contrast in scattering?) or the presence of other molecules such as lipids (getting structures of proteins embedded in lipid membranes is extremely difficult). In addition, the structure may have some left-over water molecules, called crystal waters, in it (as we will notice below):
Backup: We will edit the
pdbfile. It is a very good idea to make a backup of the file.Missing atoms? Let’s see if any atoms are missing: Find the comment ‘MISSING’ in the pdb file. You can use the command line terminal to do that or text editor. In the case you choose to use a text editor, be careful in not making any undesired changes.
Crystal waters: Find if there are crystal waters. In this case there are some. Search for lines that look like
FORMUL 2 HOH *78(H2 O)
Remove the corresponding lines. Think what the above line means before doing anything and examine the rest of the file.
Use your favourite molecular visualization software (VMD, pymol, etc.) to check the structure before and after removal of crystal waters (this is why it is good to have a backup). For that, use a proper representation (such as van der Waals or CPK) for the molecule(s). Ensure that the crystal waters have been removed.
IMPORTANT: The PDB format is absolutely strict. Do not change the format in any way, that is, do not change the number of empty spaces or labels unless you know exactly what you are doing.
Answer the questions:
Is the
1AKI.pdbmissing atoms?How many crystal waters are there?
Use VMD to show
1AKI.pdbbefore removing crystal waters and after. Use appropriate representations for the the protein and waters.
Step 1.2: Process the pdb file using pdb2gmx
Now that we have cleaned up and verified the contents of the 1AKI.pdb file, we must convert it to a Gromacs friendly format using the module pdb2gmx. As the name suggests, this converts from the pdb to a gromacs format (produces a .gro file). Two other things are done in this process:
pdb2gmxwill ask you to select a force field andwe will specify a water model (later, we will have to hydrate our molecule).
Let’s run pdb2gmx:
gmx pdb2gmx -f 1AKI.pdb -o 1AKI_processed.gro -water spce
Details:
-f           # input file
-o           # output file
-water spce  #  SPC/E water was chosen.
As described above, pdb2gmx prompts you choose a force field. Let’s pick OPLS/AA, OPLS = Optimized Parameters for Liquid Simulations, AA=All Atom.
Step 1.3: Examine the screen messages:
The execution of the above command provides lots of info on the screen. Take a look and see that you don’t get any error messages or serious warnings. There shouldn’t be any, but that is not guaranteed.
Step 1.4: Check that you got the 3 files:
Running pdb2gmx generates 3 files:
1AKI_processed.gro  # Structure/coordinates in Gromacs format. Has all the atoms.
topol.top           # System topology
posre.itp           # Position restraints of heavy atoms
All there? You should check what those files contain (but don’t mess them up!). Then it is the time to set up the simulation box and add the solvent.
Side notes:
topol.top (default name unless otherwise defined):
This file, generated by pdb2gmx, has all the information that is needed to define a molecule for a simulation. That is, interaction parameters, charges, atom types, masses, the force field, exclusions, solvent, ions, restraints, etc. See the Gromacs manual for more.
Important 1: This file gets modified when
gromppis used in the following steps -> you cannot use yourtopol.topfile from any of the previous steps.Important 2:
gromppalso modifies the.grofile at the same time as it modifiestopol.top. The records in the two files (order of molecules) MUST match.
posres.itp:
This file includes the force constants that are used to keep (restrain) the atoms in their places during equilibration: This means that the restrained atoms can move but there is a very large energy penalty on that due to the restraints. Information about position restraints is added in topol.top.
Important: whether or not restraints are used is defined by the preprocessing directive -DPOSRES in the .mdp file. The .mdp file contains all the simulation parameters (we will use it shortly).
1AKI_processed.gro:
Strictly speaking, it is not necessary to use the .gro format, but it is very convenient. If you want to use some other format, see the Gromacs manual.
Important: This file gets modified by grompp.
Answer the questions:
Why a restraints used?
When should one use them vs not?
What can go wrong when using restraints?
Step 2: Set simulation box geometry
The previous step provided us with the topology, user friendly .gro file and the restraints, and we also chose a force field. To be able to run a simulation, we have to define the space in which we simulate the molecule. For that we need boundary conditions.
Step 2.1. Put the molecule in a simulation box.
We need to define the space in which we simulate the molecule. It is called the simulation box. This also means setting the dimensions of the simulation box & defining geometry for the simulation box. Below, we will choose cubic for simplicity. Since we do not need any particular dimensions (as long as the minimum image convention is satisfied), it is ok to use the switch -d that defines the minimum distance from the box edge. That is done by executing the following command:
gmx editconf -f 1AKI_processed.gro -o 1AKI_newbox.gro -c -d 0.51 -bt cubic
-c   # centers (the molecule that was given in the pdb file).
-d   # the minimum distance from the box edge.  Must be large enough to
     # satisfy the minimum image convention when periodic boundaries are used
     # (almost always). Pay attention to the cutoff distances in the .mdp file (later)!
-bt  # box type. We chose cubic
Running the above prints lots of info on the screen such as box size, volume, angles (the messages show if the box is actually cubic), the number of atoms read by it and if velocities were present in the input file (in this case not, velocities will be initialized later). Check all that information so that you understand what is going on. In particular: pay attention to possible error and warning messages.
Now that we have our molecule, simulation geometry and boundary conditions, we are ready to fill the simulation box with water – after all, biological molecules function under aqueous conditions.
Questions to answer:
What is the minimum image convention
Is it possible, or does it make sense, to simulate proteins, DNA etc without water?
Instead of cubic, what otehr kind of simulations boxes could we choose? Which one would be the best?
Step 3: Solvate the molecule
Step 3.1. Let’s add water molecules
We need to add the solvent, that is, water molecules, in the simulation box. This is done using the module solvate and the 1AKI_newbox.gro file we created in the previous step:
gmx solvate -cp 1AKI_newbox.gro -cs spc216.gro -o 1AKI_solv.gro -p topol.top
-cp   # configuration of the protein as defined by the .gro file create in Step 2.1.
-cs   # configuration of the solvent.
-o    # output file. Solvated protein.
-p    # topology file. This is needed in order to generate the solvated output file
      # 1AKI_solv.gro. the topology file itself gets also updated: The number of solvent
      # molecules is written in it (check it). This means that you cannot use the same
      # topol.top for other systems.
Important: You may wonder why the file spc216.gro. Here’s the answer: It describes a generic 3-point water model. It can be used for all three point models (SPC, SPC/E, TIP3P).
Again, info is printed on screen. It includes:
Number of residues.
Number of atoms.
Number of atoms removed due to various overlaps (sol-sol, solute-sol).
Please check this information carefully and pay attention to possible error and warning messages.
In this case it should be something like:
6,551 solute molecules equaling to 19,653 atoms (3 per water)
21,613 atoms in total
Density 997.935 g/l and volume 344.484 nm\(^3\). Notice the units, we are using the Gromacs unit conventions.
Questions to answer
Visualize the system using VMD. You should vary the representations for water (even turning waters off) and the hen lysozyme.
Why does the exact number of atoms very during setup?
Why are there so many water molecules compared to number atoms in the peptide? How could we reduce the number of water molecules?
Step 4: Add ions
At this time we have our hen lysozyme and water in a cubic simulation box. Here, we add some ions. Why? There are several reasons. One very important one is technical: Electrostatic interactions are of long-range similar to gravity. Due this special character, we must treat the long-range part very carefully. There are several methods, but we use the so-called PME, or Particle-Mesh Ewald, algorithm. Its details are not important at this time.
What you should know at this time is:
this method is used in most production level simulations
to use this method, it is imperative that the system is charge neutral. That is, the sum of all charges (\(\sum_{i=1}^N q_i=0\)) must be precisely zero. This is the main reason for adding ions: The hen lysozyme molecule has a net charge and it is must be neutralized.
Another reason for adding ions is that ions are virtually always present in biological and other real systems.
At this stage we need an additional file, the .mdp file that contains simulations parameters. The minimal file needed is given on the next page and you should create this file and call it ions.mdp. This file must be in ASCII (text only) format. Unlike in the case of the .pdb file, the empty spaces are not important.
Step 4.1 Pre-processing by grompp
grompp generates a run input file (.tpr).
The .tpr file is in binary format. This is in contrast to the .gro and .top files which are in ASCII format.
grommp: The grompp pre-processor (also used below) always requires a .mdp file. The same .mdp file CANNOT be used for the different purposes.
What matters in the .mdp file used at this particular step:
Minimal ions.mdp:
ions.mdp
;=================================================================================
; ions.mdp
;
integrator   = steep         ; Algorithm (steep = steepest descent minimization)
emtol        = 1000.0        ; Stop minimization when F_max  < 1000.0 kJ/mol/nm
emstep       = 0.01          ; Energy step size
nsteps       = 50000         ; Maximum number of (minimization) steps to perform
;
; Parameters for performing neighbor search & calculation of interactions
;
nstlist             = 1                 ; Neighbor list & long range forces update frq
cutoff-scheme       = Verlet
ns_type             = grid              ; Method for neighbor list (simple, grid)
coulombtype         = PME               ; Method for long range electrostatics
rcoulomb            = 1.0               ; Real space electrostatic cut-off
rvdw                = 1.0               ; Short-range Van der Waals cut-off
pbc                 = xyz               ; Periodic Boundary Conditions
#==================================================================================
Let’s use it:
gmx grompp -f ions.mdp -c 1AKI_solv.gro -p topol.top -o ions.tpr
-f # .mdp file. This has the control parameters.
-c # .gro file. Contains the structure of the system (protein with solvent at this time).
-p # Topology of the system is in .top file. The switch -p automatically modifies the
   # topol.top file. If you don’t use -p you must edit topol.top yourself because the
   # ions must be added into it.
-o # output to ions.tpr. Combines info from ions.mdp, 1AKI_solv.gro and topol.top -o out
Note: While .gro is an ASCII file, .tpr is a binary file.
Step 4.2 grommp messages
A lot of information gets printed on screen. Take a look and ensure that there are no error messages. There is one particularly important message: One of the notes will tell if the system has non-zero charge. In this case it does, the message is:
  NOTE 2 [file topol.top, line 18409]:

    - System has non-zero total charge: 8.000000
    - Total charge should normally be an integer.
This means that to neutralize (MUST be done) the system, you need to add 8 ions of valence one (-1 to be precise). This will be done in the next step using genion.
Now that we have all the info combined in the file ions.tpr, let’s process it using genion.
Step 4.3 Add ions to neutralize the system using genion
The .tpr is the run input file.
gmx genion -s ions.tpr -o 1AKI_solv_ions.gro -p topol.top -pname NA -nname CL -nn 8
-s      # specifies the run input (.tpr) file.
-o      # specifies the structure output file (.gro).
-p      # topology (.top) file. This will be changed: Waters will be removed and ions added.
-pname  #  Name of positive ions. MUST be in capitals. No residue names allowed!
-nname  # Name of negative ions. MUST be in capitals. No residue names allowed!
-nn     # Number of negative ions.
When genion is executed it will ask prompt you to
Select a continuous group of solvent molecules.
Select the SOL group. That choice asks genion to replace molecules in the SOL group by ions. If you pick a protein group, parts of the protein will be replaced by ions.
Pre-processing & setup is now completed. The next step is energy minimization.
We have two steps left before production simulation(s) can start:
Energy minimization. This is typically done by using the method of steepest descents or the conjugate gradient method
Equilibration. Typically done by running short NVT and possibly also NpT simulations.
Questions to answer
Visualize the system using VMD. You should vary the representations for water (even turning waters off), ions and the hen lysozyme.
Use the Gromacs manual to find out what the parameter
nstlistis in the.mdpfile.What are counterions?
What is the difference between salt and counterions?
Step 5: Energy minimization
Done by:
mdrunSyntax:
gmx mdrun {options}Pre-requisites:
grompp.
Putting the molecules and ions in the system is more or less a random process. There may be steric problems (partial overlaps, too tight packing, too loose packing), energetically unfavourable conformations and so on. Thus, the structure needs to be relaxed and that is done by energy minimization. Gromacs has three minimization routines:
Step 5.1.
We need an .mdp file for energy minimization. In the .mdp file, the method of energy minimization is in the entry integrator. These are the current options:
integrator steep    ; steepest descents
integrator cg	    ; conjugate gradient
integrator l-bfgs   ; quasi-Newtonian Broyden-Fletcher-Goldfarb-Shannon. Not parallel.
At this time, the best options are steepest descents and conjugate gradient. Remember that they are deterministic optimization methods. Either one can be chosen. The setting are in the tabs.
integrator:         steep    ; choose steepest descents
maximum step size:  emstep   ; in nanometers. Typical: 0.01
tolerance:          emtol    ; kJ mol-1 nm-1. Typical: 1000. Stops
                             ; when max force <emtol max
number of steps:    nsteps   ; Typical: 50,000
integrator:     cg      ; conjugate gradient
tolerance:      emtol   ; kJ mol-1 nm-1. Typical
Note: emtol gives the maximum force. It is well possible that after minimization F_max > emtol. In that case you must figure why that is since it is quite likely that the simulation will not be stable.
In both cases parameters for interactions & finding neighbors must be specified:
nstlist             ; neighbor list upd8 frequency. Typical: 1
cutoff-scheme       ; group or verlet based pair list.
                    ; For GPU: verlet only
ns_type             ; How to compute neighbor list. Typical: grid. Faster
coulombtype         ; Long-range electrostatics. Typical: PME
rcoulomb            ; Short-range electrostatic cut-off. Typical: 1.0.
rvdw                ; Van der Waals cut-off. Typical: 1.0
pbc                 ; Periodic Boundary Conditions. Typical: xyz
In practise, the choice is between steepest descents and conjugate gradient. Both are deterministic methods, that is, they will stop when they find the first local minimum. Due that, sometimes it may be good to run minimization again after short equilibration (next step).
5.1.1 Minimal .mdp file energy minimization:
Typical .mdp file for performing energy minimization looks like the one given in the dropdown. Create the file and call this e-min.mdp. See also the full catalogue of options from Gromacs manual.
e-min.mdp
Copy and paste this to a new file. Call it e-min.mdp. Note again that nsteps is not related to time and that is nothing to with time when used when with steepest descents or conjugate gradient. The parameter nsteps only gives the maximum number of steps can be taken if the systems doesn’t converge before; nsteps works as a safeguard.
When used with an MD simulation nsteps is, however, the number of time steps
;==================================================================================
integrator      = steep      ; Algorithm (steep = steepest descent minimization)
emtol           = 1000.0     ; Stop when max force < 1000.0 kJ/mol/nm
emstep          = 0.01       ; Energy step size
nsteps          = 50000      ; Maximum number of (minimization) steps to perform
;
;== Interactions + finding neighbours ==============
;
nstlist        = 1      ; Neighbor list upd8 frequency. shouldn't matter w/ Verlet
cutoff-scheme  = Verlet ; Works for GPU too (‘group’ does not)
ns_type        = grid   ; How to determine neighbor list (simple or grid)
coulombtype    = PME    ; Long-range electrostatics
rcoulomb       = 1.0    ; Short-range (real space) electrostatic cut-off
rvdw           = 1.0    ; Van der Waals cut-off
pbc   	       = xyz    ; Periodic Boundary Conditions
;==================================================================================
Step 5.2. Run grompp
Now we are ready to run grompp to combine .mdp (parameters), .top (topology) and .gro (structure) files.
Important: Files that get modified: .top and .tpr
gmx grompp -f minim.mdp -c 1AKI_solv_ions.gro -p topol.top -o em.tpr
With this, we can now perform energy minimization.
Step 5.3. Run mdrun for energy minimization.
With all the necessary steps taken above, the next is very simple:
gmx mdrun -v -deffnm em
The syntax:
mdrun       # obvious
-v          # verbose output so that you can follow what is happening
-deffnm     # file names for input and output (all files will be named using this)
The following files will be generated by mdrun:
em.log		# log file
em.edr		# energy. Binary file
em.trr		# Trajectory. Full precision, binary format.
em.gro		# Energy minimized structure
How do you know it worked out?
Let’s plot: to do: plot and find out F_max & energy automatically
Next, we need to examine how the potential energy behaved. First, extract the data from the .edr file and then plot the resulting .xvg file with xmgrace (gnuplot would work as well without any modifications).
gmx energy -f em.edr -o potential.xvg
xmgrace potential.xvg
In the above, running the energy module gives a prompt asking what do you want (here, potential energy). Plots are shown below (plotted with xmgrace)
Questions to answer:
Perform minimization with both the steepest descents and the conjugate gradient method. Plot the results in the same plot. Are the results identical? Explain your observations.
Step 6: Equilibration
Done by module
mdrun.Needs:
gromppImportant: This step uses the
posre.top, the position restraint file that was created earlier.Typical run times: 20-100 ps.
Note: Depending on the system, equilibration may need several steps. For example, short NVT simulation and then a short NpT simulation. Or it may be necessary to return the energy minimization after NVT.
Remmber that energy minimization procedure is exactly what the names says, deterministic minimization. There is no dynamics. During equilibration, we will run NVT molecular dynamics.
Important: In the energy minimization procedure there was no temperature. Here, since we have an NVT ensemble, the system must be brought to equilibrium at some chosen temperature.
Step 6.1. Prepare the .mdp file.
We must prepare a .mdp file for the NVT MD simulation. Minimal .mdp file could look like this:
sample mdp file
Here is a sample .mdp file. Modify and (re)name it as needed for NVT and NpT simulations. The file lists many other options than what we need in a minimal equilibration run. You will need to adjust the number of steps (nsteps during each of the stages (energy minimization, NVT and NpT).
;=============================================================================
; - Equilibration:      Use -DPOSRES. Requires posres.top created earlier
;                       Use for both NVT and NpT equilibration.
; - Production:         -DFLEXIBLE if flexible water is used
; define = -DFLEXIBLE  ; flexible water instead of rigid. Pay attention to constraints!
define =   -DPOSRES    ; Position restraints used. posres.top is used here!
;
; Basic run control.
;====================================
; - dt:	                no constraints: 0.01, with constraints: 0.02
;
integrator  = md        ; standard leap-frog. others are available incl. vv
dt          = 0.001     ; time step in ps. This would be 1 fs. 2 fs is std.
nsteps      = 5000      ; # of steps. This would mean 5 ps for MD.
nstcomm     = 100       ; frequency (in steps) to remove com motion; CHECK!!
;
; Neighborlists and related.
;========================================
;
cutoff-scheme = Verlet  ; Verlet is needed for GPU
; nstlist     = 10      ; neighbor list update frq. Verlet: 20-40, group <10
ns_type	      = simple  ; method for constructing neighbor lists. Grid is faster
pbc           = xyz     ; Full periodic boundary conditions
; verlet-buffer-tolerance = 0.005 ; max error for pair interactions/particle Verlet
; rlist       = 0.9     ; w/ Verlet: ignored & auto-determined by the previous
;
;
; Basic output control.
;=====================================
;
; tinit	=           ; starting time
; tinit-step  =     ; for restarts
nstxout    = 500    ; coordinates out every 0.5 ps. Standard: 1.0 ps
nstvout    = 500    ; frq for writing out velocities
; nstfout  =        ; frq for writing out forces
nstenergy  = 500    ; frq for writing out energies
nstlog	   = 500    ; frq for updating the log file
; energygrps   =    ; groups to write to energy file
;
;  Electrostatics.
; =============================
;
coulombtype     = pme       ; you really do want to use PME
rcoulomb        = 0.9       ; Coulomb cutoff
pme_order       = 4         ; interpolation order needed by PME: 4=cubic
fourierspacing  = 0.12      ; FFT grid spacing used by PME.
;
; ewald_rtol      = 1e-5 ; does this matter for PME? Does. Needed?
; ewald-geometry  = 3d	 ; 3dc is quasiperiodic
; epsilon-surface = 0	 ; Dipole correction: be careful
;
; Van der Waals interactions.
;========================================
;
; -rvdw MUST be chosen to be commensurate with rcoulomb
;
; vdwtype     =           ;
; vdwmodifier = none      ;
; rvdw-switch =           ;
rvdw          = 0.9       ; vdW cutoff. NOTE:
dispcorr      = EnerPres  ; options: no, EnerPres, Ener
;
; TEMPERATURE COUPLING.
;===============================
;
tcoupl   = v-rescale    ; v-rescale is currently THE choice over NH and Berendsen
ld-seed	 = -1           ; seed for LD, v-rescale, BD. Is this needed??
;
;### Only one group coupled
; tc-grps = system      ; groups to couple separately to t-bath
; tau_t	  = 0.1         ; same value for v-rescale & Berendesen
; ref_t	  = 300         ; temperature in Kelvin
;
;#### Couple different groups (usually the better way):
;
tc-grps	 = Protein Non-Protein  ; couple separately
tau_t    = 0.1 0.1              ; with the above
ref_t    = 300 300              ; temperatures in Kelvin
;
; PRESSURE COUPLING.
;==============================
;
;## If NVT, then:
;
pcoulp            = no      ; This for NVT
;
;## If NpT AND if Berendsen, then:
;
; pcoupl          = berendsen ; barostat
; pcoupltype      = isotropic ; semiisotropic for membranes. two values needed
; compressibility = 4.5e-5    ;
; tau_p           = 1.0       ;
; ref_p           = 1.0       ; pressure in bars
;
;## If NpT AND Parrinello-Raman, then:
;
; pcoupl            = Parrinello-Rahman	; barostat
; refcoord_scaling  = com	            ; scale com of the ref coords w/ the scaling matrix
; pcoupltype        = isotropic         ; semiisotropic for membranes. two values needed
; compressibility   = 4.5e-5            ;
; tau_p             = 2.0               ; time constant (different from Berendsen)
; ref_p             = 1.0               ; pressure in bars
;
; Generate velocities?
;=================================
;
; NOTE: gen_vel = no if the run is a continuation!
;
gen_vel     = yes       ; generate velocities from a Maxwell distribution
gen-seed    = -1        ; random seed for random number generation
gen_temp    = 300       ; temperature for the above Maxwell distribution
;
; Constraints.
;==========================
; -Check your preprocessing options. Should be chosen to be compatible
; - Q: Does -DPOSRES take care of everything & the below is only needed in full runs?
;
; constraints          = all-bonds   ; all bonds constrained. Must be used in initial equilibration
; constraint-algorithm = LINCS       ;
; lincs-iter           = 1           ; accuracy of LINCS
; lincs-order          = 4           ; for higher accuracy, use 6


; Are we continuing a previous simulation
;================================================
;
; This is also needed when running back-to-back equilibration runs! (NVT-> NpT)
; IMPORTANT: You may need to set gen_vel=no above.
;
continuation	= yes ; restarting a previous run
Step 6.2. Run grompp to combine structure, topology and parameters for mdrun
Use the template for the .mdp file above, name it appropriately and notice the following:
We are now using the position restraints that we defined above (file
posre.top)In your
.mdpfile:The option
define = -DPOSRESmust be uncommented (=active)Activate the option
constaint algorithmand selectlincsset
constraints = h-bondsset
lincs_iter = 1set
lincs_order = 4
Using
lincsallows you to set the time step to0.002, that is two femtoseconds. Do that.Check that you have no pressure coupling and that you have temperature coupling. You can compare to the options used in water simulations.
Let’s grompp:
gmx grompp -f nvt.mdp -c em.gro -p topol.top -o nvt.tpr
-f nvt.mdp    ; input, not modified. Uses posres.top
-c em.gro     ; the structure for energy minimization as input. not modified
-p topol.top  ; topology
-o nvt.tpr    ; trajectory output.
Step 6.3 Start the equilibration run using mdrun. NVT run.
IMPORTANT 1: before starting the run, make an estimate how many time steps are feasible and how much data is produced (=you should check that you have enough disk space).
IMPORTANT 2: Running an MD simulation is very CPU/GPU intensive. Remember to ensure that all the ventilation openings are clear of any obstructions as otherwise there is a serious danger of overheating and damaging your computer. If your computer has passive cooling, break the simulation to smaller pieces to avoid overheating. That can be done using the parameter continuation in the .mdp file. We already did that in water simulations.
IMPORTANT 3: You can also use the verbose option in the command below to see how long time the simulation is predicted to take (it also shows you the remaining time). See the Gromacs manual for details.
Let’s finally run an MD simulation!
gmx mdrun -deffnm nvt
mdrun       # obvious
-deffnm     # file names for input and output (all files will be named using this)
Answer the following questions:
Plot temperature as function of time
Plot pressure as function of time
Plot the total energy as a function of time
Use VMD to generate a visulization of the system
Why do we need a thermostat?
Check from the Gromacs manual what kind of thermostat are available.
Step 7 Start the 2nd equilibration run using mdrun: NpT run.
Modify (and rename) the .mdp file to perform a short 5-20 ps (depending on your computer) NpT run. For this you need to edit the `.mdp file and activate pressure coupling
Answer the following questions:
Plot temperature as function of time
Plot pressure as function of time
Plot the volume of the simulation box as a function of time
Plot the density as a function of time. Compare with experimental data (you need to search literature for that).