1. Molecular visualization and VMD
Learning goals:
To learn the importance and utility of molecular visualization
To learn the basic use of VMD
Keywords: visualization, physical model, molecular graphics, VMD, VMD Plugins, atomistic simulations
Associated material:
More on VMD:
VMD tutorial from the VMD web site
VMD documentation and tutorials from the VMD web site
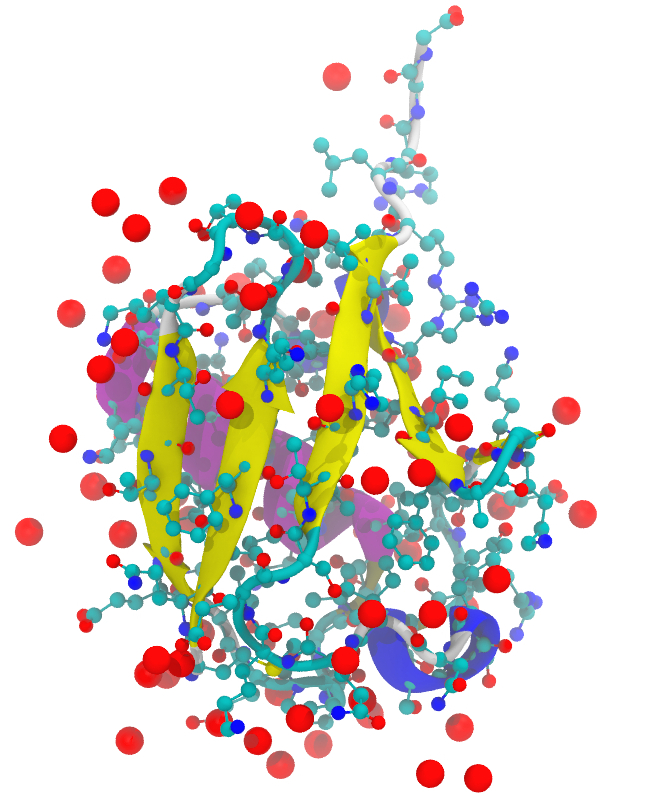
Note: This visualization was done with VMD using its internal Tachyon rendering with high resolution settings. The molecule is the structure 1UBQ (ubiquitin) from the PDB database. The visualization combines several different representations.
1.1. Why visualize?
Visualization is a key part of any data analysis, computational or experimental. It can quickly reveal important features or problems. Using simulation data to produce movies is particular powerful as it allows one to focus the time evolution of particular part(s) of any molecule(s) or molecular property. One can also easily overlay properties/structures for comparison.
1.1.1. Physical models: The model of Watson and Crick
The physical molecular model of Watson and Crick for the double stranded DNA is probably the most famous such a model. Although a physical model, it is a visualization based on (in this case experimental) data. Molecular graphics, that is, molecular visualization using computers, can of course produce different representations based on both experimental and computational data. Even in the case of experimental data, a molecular model is required to create a representation.
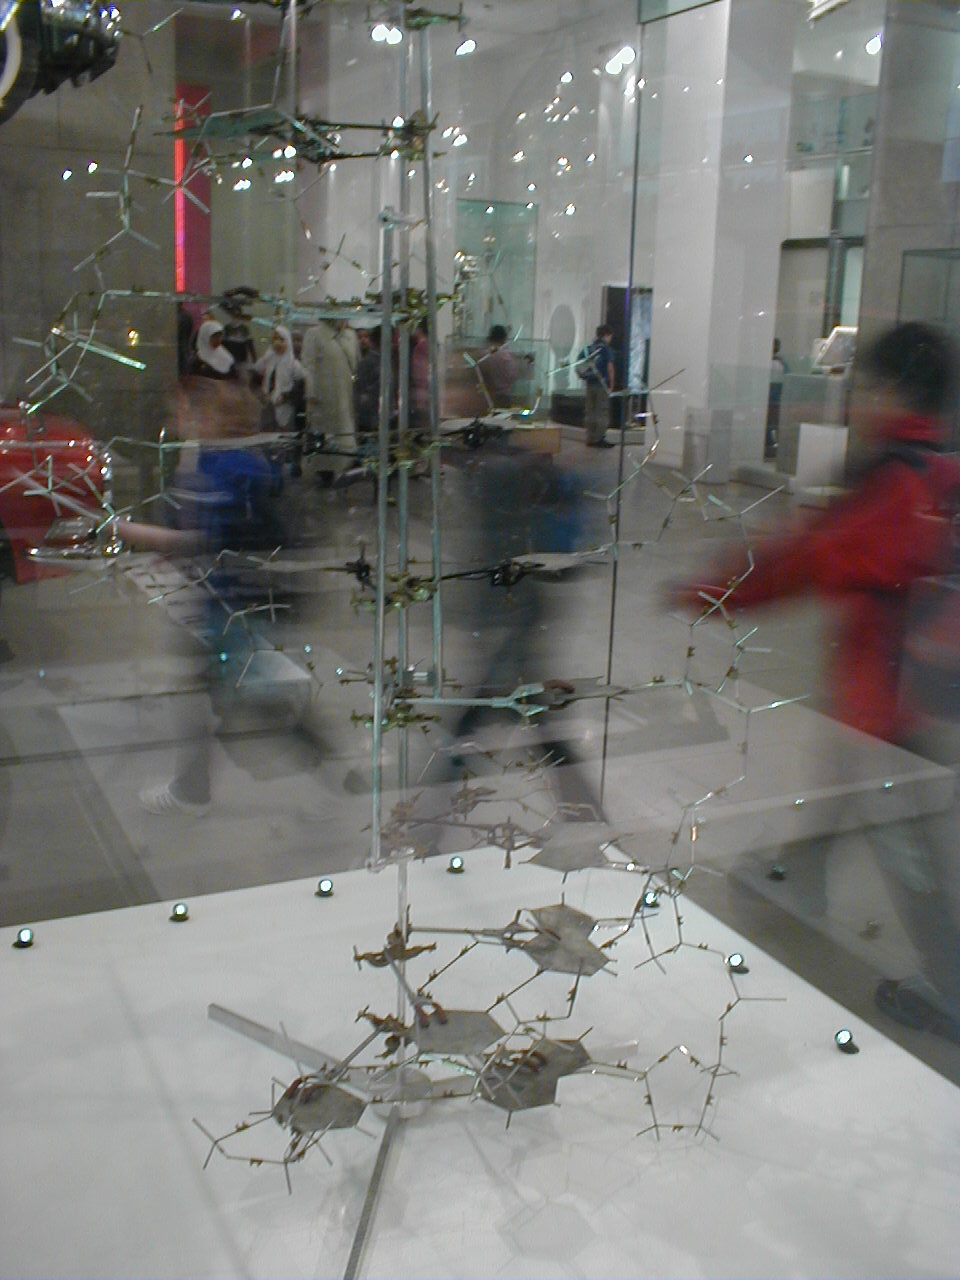
Fig. 1.4 The physical molecular model (National Science Museum, London, UK) that Crick and Watson built for DNA in 1953. The individual nucleobases were cut out of aluminum. In terms of molecular models, they used rods or licorice for bonds and sheets for nucleobases. The model itself was based on experimental data of Rosalind Franklin, Maurice Wilkins and Alexander Stokes. The model allowed Crick and Watson to model how the helical structure and hydrogen bonding emerges based on the data. The DNA is a double helix and around the same time (1953), Linus Pauling proposed a triple-helical model for DNA. Figure: Wikipedia, public domain.
1.1.2. Molecular graphics
The term molecular graphics is most commonly used to refer to computer-based visualization of molecules although the term can be interpreted more broadly. It dates back to an MIT project on interactive molecular structures in the 1960’s and in particular to Cyrus Levinthal who applied computer graphics to show protein structures. Levinthal is also known for Levinthal’s paradox. Interestingly, Levinthal got his PhD in physics but later moved on to Molecular Biology.
The difficulty with molecular graphics is that one has two dimensional representations of 3D objects (molecules). There are very interesting developments in using virtual reality applications for molecular modeling, see for example [1].
One of the strengths of visualization software is to apply different representations at the same time. That allows one to visualize different aspects and their relations.
1.1.3. Experiments and visualization
Visualization is equally important for experimental data, in particular for data from x-ray scattering, NMR (Nuclear Magnetic Resonance; Nobel Prize in Chemistry 1991 to Richard Ernst) and CryoEM (Cryogenic Electron Microscopy; Nobel Prize in Chemistry in 2017 to Jacques Dubochet, Joachim Frank and Richard Henderson). Most of the RCSB Protein Databank (PDB) database entries are results of using these methods.
1.1.4. More reading
Molecular graphics from Wikipedia
History of Visualization of Biological Macromolecules by Eric Martz and Eric Francoeur
History of Visualization of Biological Macromolecules: On-line Museum
1.1.5. Videos discussing visualization
Movie: Molecular Visualization: Principles and Practice by Stuart Jantzen
Molecular visualization with VMD: Westgrid / Compute Canada workshop
Virtual Reality Molecular Dynamics Visualization
Cecilia Clementi: Learning molecular models from simulation and experimental data
This is a full research talk by Prof. Cecilia Clementi in “Machine Learning for Physics and the Physics of Learning.”
Scalable Molecular Visualization and Analysis Tools with VMD by John Stone, UIUC
Dr. John Stone is the lead developer of VMD.
1.1.6. Visualization and the PDB database
The PDB database (Protein Data Bank)) uses visualization very effectively for the deposited structures. Each molecule has 3D representations that can be rotated and changed on-line. In addition, PDB has the Molecule of the Month. For example, see the entry for Sars-CoV-2 Spike protein in Molecule of the Month. The static images use different representations and colors to express chosen features and at the bottom of the page it is possible to explore the structure and change representations on-line (the JSmol tab). This shows how much information visualization can convey more or less immediately.
See for example:
Example PDB web page with visualization
1.2. Molecular visualization software: VMD
Here, we use VMD for visualization[4]. It is one of the world’s most popular visualization and analysis software for molecular systems.
1.2.1. List of some popular visualization software
Before start with VMD, let’s list some alternatives. There are, of course, lots of excellent software packages for visualization. Below is a list of some of the popular ones and choice often depends on the purpose, that is, is the aim to visualize (and analyze) data from experiments or simulations and produce figures for publications and reports or perhaps have live demonstrations on web page or even interactive web pages. For example, VMD and PyMol are great choice for the former but not suitable for latter purpose. For web based visualization one could use software such as Jmol/JSmol or NGL, but they are not as well suited for complex visualization and analysis as VMD or PyMol.
VMD - Visual Molecular Dynamics
Linux, MacOS and Windows
-
Avogadro’s is somewhat different from VMD and PyMol in that, besides visualization, it is primarily a molecule editor, that is, it can be used to construct molecules. Avogadro is not the software of choice for generating movies, but it has unique capabilities in molecular design. It has also extension for geometry optimization, molecular orbitals, QTAIM (Quantum Theory of Atoms in Molecules) calculations, calculation of spectra and other features.
Open source
GUI driven and has capability for plugins
Linux, MacOS and Windows
List of molecular graphics systems from Wikipedia
List of molecular design software from Wikipedia.
1.3. What is VMD
VMD - Visual Molecular Dynamics - is a general purpose software for 3D molecular visualization and data analysis of molecular systems. Together the NAMD simulation software, it can also be used to run interactive MD simulations and for setting up NAMD simulations. Both VMD and NAMD are developed in Theoretical and Computational Biophysics Group at the University of Illinois at Urbana-Champaign[4].
VMD was originally designed for visualization and analysis of biological systems, but it is a general purpose software that is not limited to any particular system. It can read essentially all common molecular file formats and data produced by most common software including PDB, XYZ, NAMD, Gromacs, Amber, CPMD, and it can be used to visualize and analyze data from classical, coarse-grained and quantum simulations. VMD includes a lot of various analysis tools and it has a plugin system for developers. VMD is also able to use CUDA acceleration if an NVIDIA GPU is present.
1.3.1. Operating systems
VMD is available for Linux, Windows and OSX. VMD has both a GUI and a command line interface.
1.4. VMD: Basic operation
Here, only the basic operations of VMD are reviewed. It is impossible to provide all its details as VMD has extremely feature set for both visualization and analysis. The focus here is on visualization only. The aim of the examples below is to show some of VMD’s capabilities and the demonstrate some of the features of its user interface.
1.4.1. Example: Visualizing human islet amyloid polypeptide
Let’s start with a simple example. For that, we download a molecule from the PDB database. In this case, the PDB ID 5MGQ was selected. The molecule 5MGQ is an oxidized and amidated human islet amyloid polypeptide (IAPP) and it is an important molecule in diabetes II.
The structure in that file contains 20 frames and we will use the last frame. The term frame means a snapshot of the molecule. Frames can come, for example, from repeated experiments or from different times steps of a simulation. In the case of VMD, the number of frames contained in a file is indicated in the VMD Main window as will be shown in the next section where the VMD user interface is demonstrated.
The figure below shows five different representations of the molecule 5MGQ created by VMD. The figures show the same molecule form the exact same angle; nothing else has been changed except the representation, that is, coloring method, drawing method and material. What exactly these terms mean will be come apparent shortly, at this time the important thing is to see that one can convey different information by different representations. The names of the drawing methods (VMD uses these names as do many other software) are provided under each of the images.
It is also important to notice that one can very easily (and we will see how this works) overlay representations. This is illustrated in the third image from the left where two representations, new cartoon and licorice, have been overlayed. The number of ways of selecting atoms and molecules and how they are represented is extremely versatile. We will see how that works in the second example in thee next section. As it is clear from the figure, VMD can produce high-quality publication level graphics. It can also be used to render very high quality molecular movies as will be discussed later.

Fig. 1.5 Different representations of the PDB ID 5MGQ (final structure out of 20 frames)), oxidized and amidated human islet amyloid polypeptide (IAPP). This peptide is involved in the human diabetes II. Different representations are useful different purposes. From left to right: Lines with the residues show in different color, New Cartoon with coloring using secondary structure, New Cartoon and Licorice representations superposed, van der Waals, and Bonds. These and many others are available in VMD in Graphics -> Representations. Rendering using Tachyon. Click the image to see it in high resolution.
1.4.2. VMD’s user interface
The user interface of VMD does not depend on the operating system. Starting VMD opens three windows: The VMD Main window, the Display window and VMD console. The best way to get familiar with VMD is to use it.
When VMD is started, the screen looks like below (with the exception that your Display window will have black background as I have changed mine to white in my default settings). In the examples below, the file spc216.gro that comes with Gromacs is used. If/when you have Gromacs installed, the file is located under the Gromacs installation directory in share/gromacs/top. As the name indicates, the file is in Gromacs’ .gro format and VMD knows how to read the format (as it did with the above PDB case). The file is a small box (size of 1.86206 nm as shown on the last line of the file) of 216 SPC water molecules. I strongly encourage you to download the above PDB file (5MGQ), or any other PDB file, as well as try spc216.gro once Gromacs has been installed.
Below are an example of a .gro file and a picture of the VMD opening screens.
Example of the .gro format
The output below has been extracted (5 water molecules out of 216 were selected) from the file spc216.gro that comes with Gromacs. The .gro format but during a simulation binary formats are used since they take much less space to store. If you don’t have Gromacs installed yet and hence no access to spc216.gro, you can copy and save the example below and visualize it in VMD (example is shown below). Notice that to save the date, you must use an ASCII text editor such as vi or comparable.
The 1st line has comments. Arbitrary information can be included and this line is ignored by analysis software. In this case is says: 5 water molecules, SPC model, temperature of 300K and box size of 1.86206.
The 2nd line: The total number of atoms. This information is required by the
.groformat.The lines starting with number and SOL: 1SOL is the 1st solvent molecule. 2SOL: second solvent molecule and so on. Each solvent/water molecule consist of three atoms: OW, HW1, HW2.
OW: Water oxygen
HW1 and HW2: Water hydrogens 1 and 2.
The 3rd column: Numbering of individual atoms. Each atom must have a unique identifier.
Columns 4-6: x, y and z coordinates in nanometers.
The last line: the size of the simulation box in nanometers.
For example, VMD understand this format and can read and visualize the data. Notice also that formatting is strict (column position do matter)..
5H2O,SPC-MODEL,300K,BOX(M)=1.86206
  15
    1SOL     OW    1    .230    .628    .113
    1SOL    HW1    2    .137    .626    .150
    1SOL    HW2    3    .231    .589    .021
    2SOL     OW    4    .225    .275   -.866
    2SOL    HW1    5    .260    .258   -.774
    2SOL    HW2    6    .137    .230   -.878
    3SOL     OW    7    .019    .368    .647
    3SOL    HW1    8   -.063    .411    .686
    3SOL    HW2    9   -.009    .295    .584
    4SOL     OW   10    .569   -.587   -.697
    4SOL    HW1   11    .476   -.594   -.734
    4SOL    HW2   12    .580   -.498   -.653
    5SOL     OW   13   -.307   -.351    .703
    5SOL    HW1   14   -.364   -.367    .784
    5SOL    HW2   15   -.366   -.341    .623
     1.86206   1.86206   1.86206
The output, when visualized using VMD, looks like this:
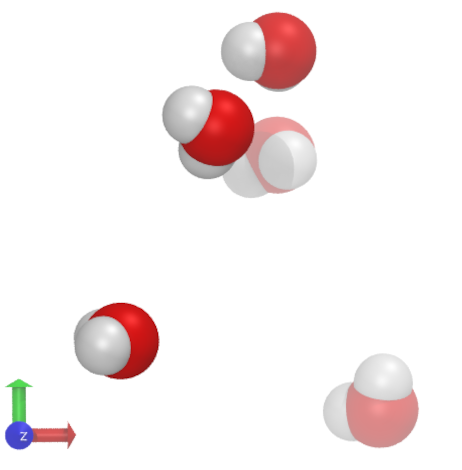

Fig. 1.6 Upon opening VMD, three windows are displayed. The option Save Visualization State... is very useful as it allows one to save the visualization project and read it with Load Visualization State when restarting. Another great feature is that saved state can be used cross-platform, that is, it doesn’t matter if it was saved on a Mac, it can be used on Windows or Linux as well (file path may need to adjusted, however). The console allows one to execute commands directly. The downside with the console is that one cannot use the arrow keys to move back and forth or recall previous commands. There is, however, a remedy: Under Extensions there is the option Tk Console that has all those features.
1.4.2.1. Load a molecule
As the next step, the file spc216.gro was loaded (File -> New Molecule). The Display window (not shown here) first shows the molecules using Line representation; the default representation can be changed but lines are very quick to render so there is no need to change that setting.
Let’s first focus on VMD Main window and Graphical Representations. The figure below shows some of the key feature including the molecule name, the number of frames (the file spc216.gro has only one frame), the number of atoms and so on.
The window Graphical Representations is opened through VMD Main -> Graphics -> Representations. That windows shows the selected molecule; here we have only one molecules but it is possible to have more although the most typical situation is to work with a single molecule. Graphical Representations.
Some of the other important features Graphical Representations include the Representations panel. Here, it shows that the Drawing Method (red circle) or Style (in the Representations panel) is Lines, Coloring Method or Color is Name and the all atoms have been selected. The buttons Create Rep and Delete Rep allows creation deletion of representations. This is also how different representations can be overlayed: Simply by creating new representations. The Material selector has the material/texture for representation. In addition there are the tabs Draw style (the currently selected one) , Selections (it has the keywords and keys for selecting atoms and molecules by different criteria), Trajectory (when one has multiple frames especially for movies and analysis, this tab has update options for the frames)) and Periodic (allows selection of periodic images of the system).

Fig. 1.7 The VMD Main window and Graphical Representations (under Graphics). Some of key features are indicated. The Drawing Method selector has been opened to demonstrate the different methods for representing molecules. In the above figure showing 5MGQ, lines, new cartoon, licorice, van der Walls (VDW) and bonds were used. Coloring allows to emphasize, for example, atoms, groups or structures. In the 5MGQ, the second image from the left used New Cartoon as the Drawing Method and Secondary Structure as the Coloring Method. The Selections tab shows the different standard selections.
1.4.2.2. Representations and rendering
Now that we have a better understanding of how to load a molecules/molecules and the interface, let’s take a more detailed look into representations and discuss rendering (=how save images on the disk). The figure below shows the VMD Main window, Graphical Representations, File Render Controls (accessible under VMD Main -> File -> Render) and the system in the Display window.
Here, we have overlayed representations. The different representations are listed in Representations panel. Two different arbitrary residues have been selected and they are represented using different styles and coloring methods. The rest of the molecules are show using CPK representation; the name CPK comes from the creators of this model, Robert Corey, Linus Pauling and Walter Koltun.
To save the figure, one has to render it. VMD has different methods for rendering. The most basic one is the one that is open in the File Render Controls window: The snapshot method. This method does exactly what the name suggests: It takes an exact snapshot of the Display window. There are no controls for resolution - it is determined by the window size. This method offers a quick way to create figures, but the quality is not good enough for publications.
High-quality figures require a different rendering method, such as Tachyon that is available from the selector.
More on the topic:
Molecular Representations in VMD from the VMD web site

Fig. 1.8 Main, rendering, graphics and display window with some of the important issues indicated. In particular, pay attention to the Selection panel and how the selections are shown in the Display window. The axes have been turned off from Display -> Axes and the background has been changed from black to white from Graphics -> Colors -> Display -> Background -> Colors.
1.4.2.3. Image rendering practicals
VMD supports a large number of high-quality rendering methods including Tachyon (comes with VMD) and povray (installation of PovRay is required for that).
One important point with the different rendering methods is that they use ray tracing and thus the basic rendering on screen may (and typically does) look different than the final high-resolution picture saved into a file. This simply means that one has to find the proper settings for a given system, simply by trying out the different options. High resolution rendering may also take significant amount of time as the process is computationally intensive.
Summary of the above and some additional practical points:
The screen capture mode for rending gives exactly what is on the screen including the screen size. That is, the screen size determines the resolution. Thus, for high quality publication level images, other methods have to be used.
Graphics -> Representations -> Material: The choice of material has a significant effect on rendering in the high quality rendering modes (=other than screen capture). Importantly, the ray tracing methods like Tachyon and PovRay produce significantly different output as compared to the screen display.Pay attention to the resolution for objects such as bonds and spheres when rendering. The settings are in
Graphics -> RepresentationsLights can be adjusted under
Display -> Lights: There are 4 optionsFor the high quality rendering options using ray tracing methods (such as Tachyon and PovRay), the options under
Display setting -> Ray tracing optionsshould be adjusted as necessary.Under
Display, there are several important options such as usingPerspectiveandOrthographicview. The latter is often the most suitable.
1.4.2.4. Rendering with Tachyon
Below are quick instructions for high quality images when using Tachyon rendering. As discussed above, the end result will be different from what one sees on the screen so it is good to try different options for Materials, lights and shadows and one should always ensure that the resolution of the objects is high enough (the default setting is not). The following options work in many cases:
Display -> Rendermode -> GLSL
Display --> Display Setting --> Shadow ON, Ambient Occl. ON
For materials, the following seems to work quite well with Tachyon:
EdgyShiny, Glass2, AOSHiny, AOEdgy
When selecting the rendering method: The following options after the render command work well. Adjust the resolution appropriately, the lines below are examples that produce large (1024 x 1024 px) high quality pictures. Increasing the value of -aasamples and using -auto_skylight add to rendering time.
-aasamples 2 %s -add_skylight 0.7 -format TARGA -res 1024 1024 -o %s.tga
-aasamples 2 -fullshade %s -format TARGA -o %s.tga
Currently, Tachyon rendering can produce the following three formats: TARGA, PSD48 (photoshop) and BMP. The common
JPEG and PNG do not work.
1.4.3. More on selections
In addition to using the readily available options from the Selections tab, VMD has also other very powerful methods for selections. One can use, distance from a given atom (or other unit), coordinates, masses, charges and so on. The figure shows and example of distance based selection. Note also that one can activate and deactivate representations but double-clicking them - in the figure, the selection indicated in red has been deactivated.
Important: When making movies using distances or coordinates for selections, it is imperative to select
Graphical Representations -> Trajectory -> Update Selection Every Frame
If not selected, the selection criterion/criteria will use the starting frame as the reference with no updates. This applies to movies (both on screen and rendered) only and has no effect on static images.

Fig. 1.9 The figure shows the use distance based selection. Note that VMD uses Ångströms for distances (Gromacs uses nanometers). The central molecules and the ones within 8 Å are shown with different materials and colors.
1.4.4. Properties of a selected atom
Choosing
VMD Main -> Mouse -> Query
allows one the query the properties of any atom by clicking on them. The properties as shown in the VMD console window. Several other useful options are available under the Mouse menu.

Fig. 1.10 The VMD console window show the properties of the selected atom. The properties use the same keywords as the selection menu and Graphical Representations.
1.4.5. Data analysis
The above focused on visualization. VMD has a wide range of built-in tools for data analysis and a plugin framework that allows users to develop their own analysis tools. We won’t cover data analysis here. One matter is, however, worth pointing out: VMD has no preset limit for the length of a trajectory. The only limitation is available memory.
1.4.6. Scripting and extensions
VMD also offers a very powerful scripting interface using Tcl/Tk and this is the method for developing analysis tools. VMD It has also an interface to PLUMED collective variable analysis (requires separate installation of PLUMED). Besides reading all the major file formats, VMD has plugins for experimental data. These include MDFF for Cryo-EM data and others.
1.4.7. More features
VMD has some NAMD-specific tools for setting up molecular simulations.
VMD has an interface for reading PDB entries by accession number directly from the PDB database. Read more background information about the PDB database.
VMD also has an interface to APBS (Adaptive Poisson Boltzmann Solver) for calculations of continuum electrostatics.
VMD has a toolkit for force field parameterization called Force Field Toolkit plugin (ffTK)
Note that many of the plugins require installation of additional software or/and libraries.
1.4.8. PDB database downloads
VMD has the capability to download PDB files directly from the PDB database. Note, however, that version 1.9.3 appears to have a problem with this feature. The ability to download has been fixed in the 1.9.4-alpha41 versions (at this time there is no stable release of 1.9.4; the alpha51 works on MacOS Catalina and Linux, but crashes on Windows 10).
This feature is available under
Extensions -> Data -> PDB Database Query
The PDB database is available at
1.4.9. Movies with VMD
This topic will covered when we have trajectory data from simulations.
1.4.10. Customizing VMD
Initial settings can be easily changed from
Extensions -> VMD Preferences
Change to according to your preference if needed and save the by clicking Write Settings to VMDRC.
For example, my preferences are white background and orthographic viewing.
1.4.11. The Tcl/Tk command shell
VMD uses the Tcl/Tk language and shell for scripting. Scripting allows automatization of tasks and more detailed analysis of properties but we won’t cover the topic here. Tcl stands for Tool Command Language and Tk is the graphical user interface toolkit for Tcl. Tcl/Tk is supported across the different operating systems (Windows, Linux, OSX).
1.5. Bibliography
- 1
Kevin C. Cassidy, Jan Šefč’ık, Yogindra Raghav, Alexander Chang, and Jacob D. Durrant. ProteinVR: web-based molecular visualization in virtual reality. PLOS Computational Biology, 16(3):e1007747, mar 2020. doi:10.1371/journal.pcbi.1007747.
- 4(1,2)
William Humphrey, Andrew Dalke, and Klaus Schulten. VMD: visual molecular dynamics. Journal of Molecular Graphics, 14(1):33–38, Feb 1996. doi:10.1016/0263-7855(96)00018-5.