Molecular visualization
Contents
Molecular visualization#
Learning goals:
To learn the importance and utility of molecular visualization
To learn the basic use of VMD
Keywords: visualization, physical model, molecular graphics, VMD, VMD Plugins, atomistic simulations
More on VMD:
VMD tutorial from the VMD web site
VMD documentation and tutorials from the VMD web site
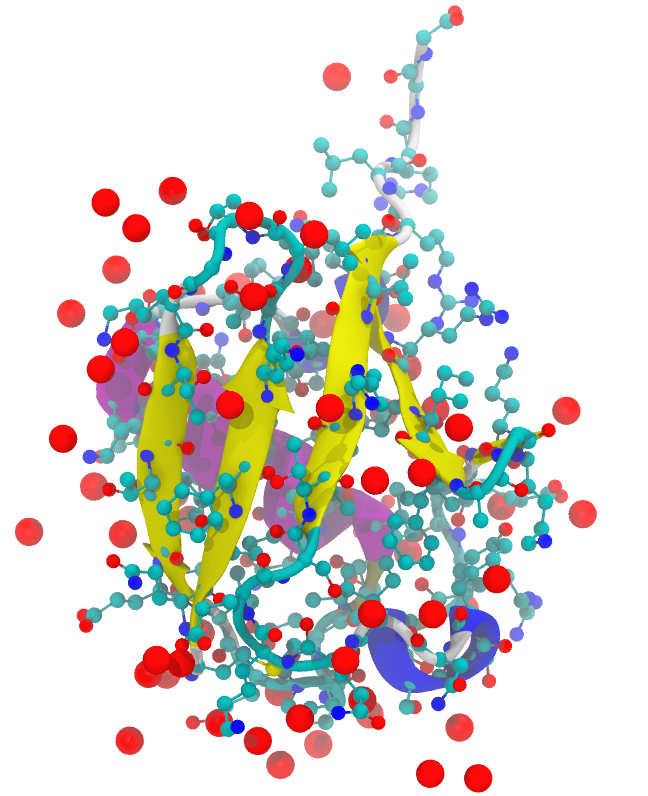
Note: This visualization was done with VMD using its internal Tachyon rendering with high resolution settings. The molecule is the structure 1UBQ (ubiquitin) from the PDB database. The visualization combines several different representations.
Why visualize?#
Visualization is a key part of any data analysis, computational or experimental. It can quickly reveal important features or problems. Using simulation data to produce movies is particular powerful as it allows one to focus on the time evolution of particular part(s) of any molecule(s) or/and molecular property. One can also easily overlay properties/structures for comparison.
Physical models: The model of Watson and Crick#
The physical molecular model of Watson and Crick for the double stranded DNA is probably the most famous such a model. Although a physical model, it is a visualization based on (in this case experimental) data. Molecular graphics, that is, molecular visualization using computers, can of course produce different representations based on both experimental and computational data. Even in the case of experimental data, a molecular model is required to create a representation.
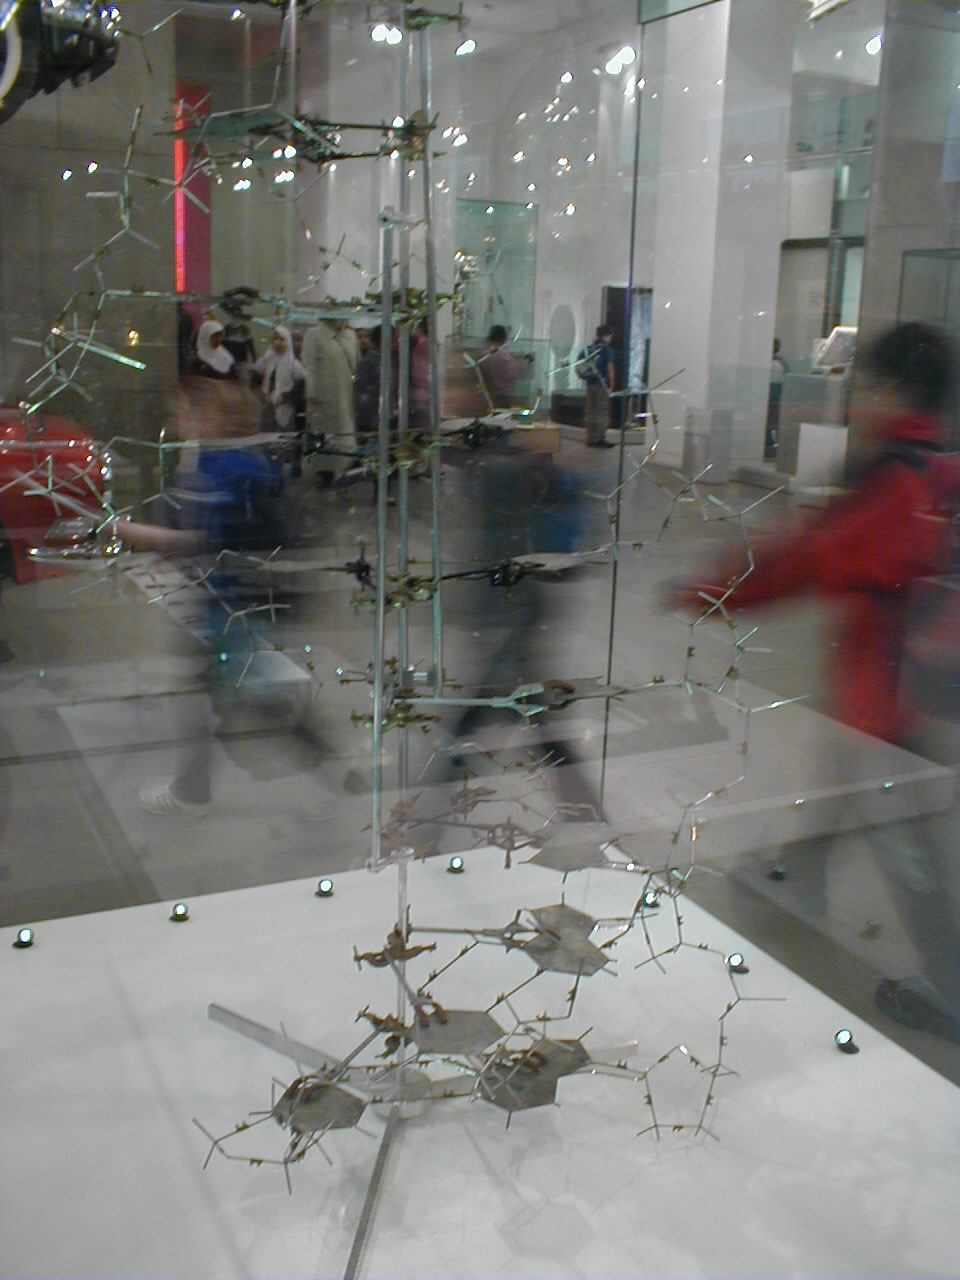
Fig. 14 The physical molecular model (National Science Museum, London, UK) that Crick and Watson built for DNA in 1953. The individual nucleobases were cut out of aluminum. In terms of molecular models, they used rods or licorice for bonds and sheets for nucleobases. The model itself was based on experimental data of Rosalind Franklin, Maurice Wilkins and Alexander Stokes. The model allowed Crick and Watson to model how the helical structure and hydrogen bonding emerges based on the data. The DNA is a double helix and around the same time (1953), Linus Pauling proposed a triple-helical model for DNA. Figure: Wikipedia, public domain.#
Molecular graphics#
The term molecular graphics is most commonly used to refer to computer-based visualization of molecules although the term can be interpreted more broadly. It dates back to an MIT project on interactive molecular structures in the 1960’s and in particular to Cyrus Levinthal who applied computer graphics to show protein structures. Levinthal is also known for Levinthal’s paradox. Interestingly, Levinthal got his PhD in physics but later moved on to Molecular Biology.
The difficulty with molecular graphics is that one has two-dimensional representations of 3D objects (molecules). There are very interesting developments in using virtual reality applications for molecular modeling, see for example [1].
One of the strengths of visualization software is to apply different representations at the same time. That allows one to visualize different aspects and their relations.
Experiments and visualization#
Visualization is equally important for experimental data, in particular for data from x-ray scattering, NMR (Nuclear Magnetic Resonance; Nobel Prize in Chemistry 1991 to Richard Ernst) and CryoEM (Cryogenic Electron Microscopy; Nobel Prize in Chemistry in 2017 to Jacques Dubochet, Joachim Frank and Richard Henderson). Most of the RCSB Protein Databank (PDB) database entries are results of using these methods.
More reading#
Molecular graphics from Wikipedia
History of Visualization of Biological Macromolecules by Eric Martz and Eric Francoeur
History of Visualization of Biological Macromolecules: On-line Museum
Videos discussing visualization#
Movie: Molecular Visualization: Principles and Practice by Stuart Jantzen
Molecular visualization with VMD: Westgrid / Compute Canada workshop
Virtual Reality Molecular Dynamics Visualization
Cecilia Clementi: Learning molecular models from simulation and experimental data
This is a full research talk by Prof. Cecilia Clementi in “Machine Learning for Physics and the Physics of Learning.”
Scalable Molecular Visualization and Analysis Tools with VMD by John Stone, UIUC
Dr. John Stone is the lead developer of VMD.
Visualization and the PDB database#
The PDB database (Protein Data Bank)) uses visualization very effectively for the deposited structures. Each molecule has 3D representations that can be rotated and changed on-line. In addition, PDB has the Molecule of the Month. For example, see the entry for Sars-CoV-2 Spike protein in Molecule of the Month. The static images use different representations and colors to express chosen features and at the bottom of the page it is possible to explore the structure and change representations on-line (the JSmol tab). This shows how much information visualization can convey more or less immediately.
See for example:
Example PDB web page with visualization
Bibliography#
- 1
Kevin C Cassidy, Jan Šefčík, Yogindra Raghav, Alexander Chang, and Jacob D Durrant. ProteinVR: web-based molecular visualization in virtual reality. PLoS Comput. Biol., 16(3):e1007747, March 2020. doi:10.1371/journal.pcbi.1007747.